- Advertising
Why eCPMs Rise and Fall Throughout the Year (And How to Work With It)
•
This article was updated on January 21, 2026, to reflect the 2026 eCPM calendar.
If you’ve ever looked at your dashboard and thought, “What just happened?” You’re not alone.
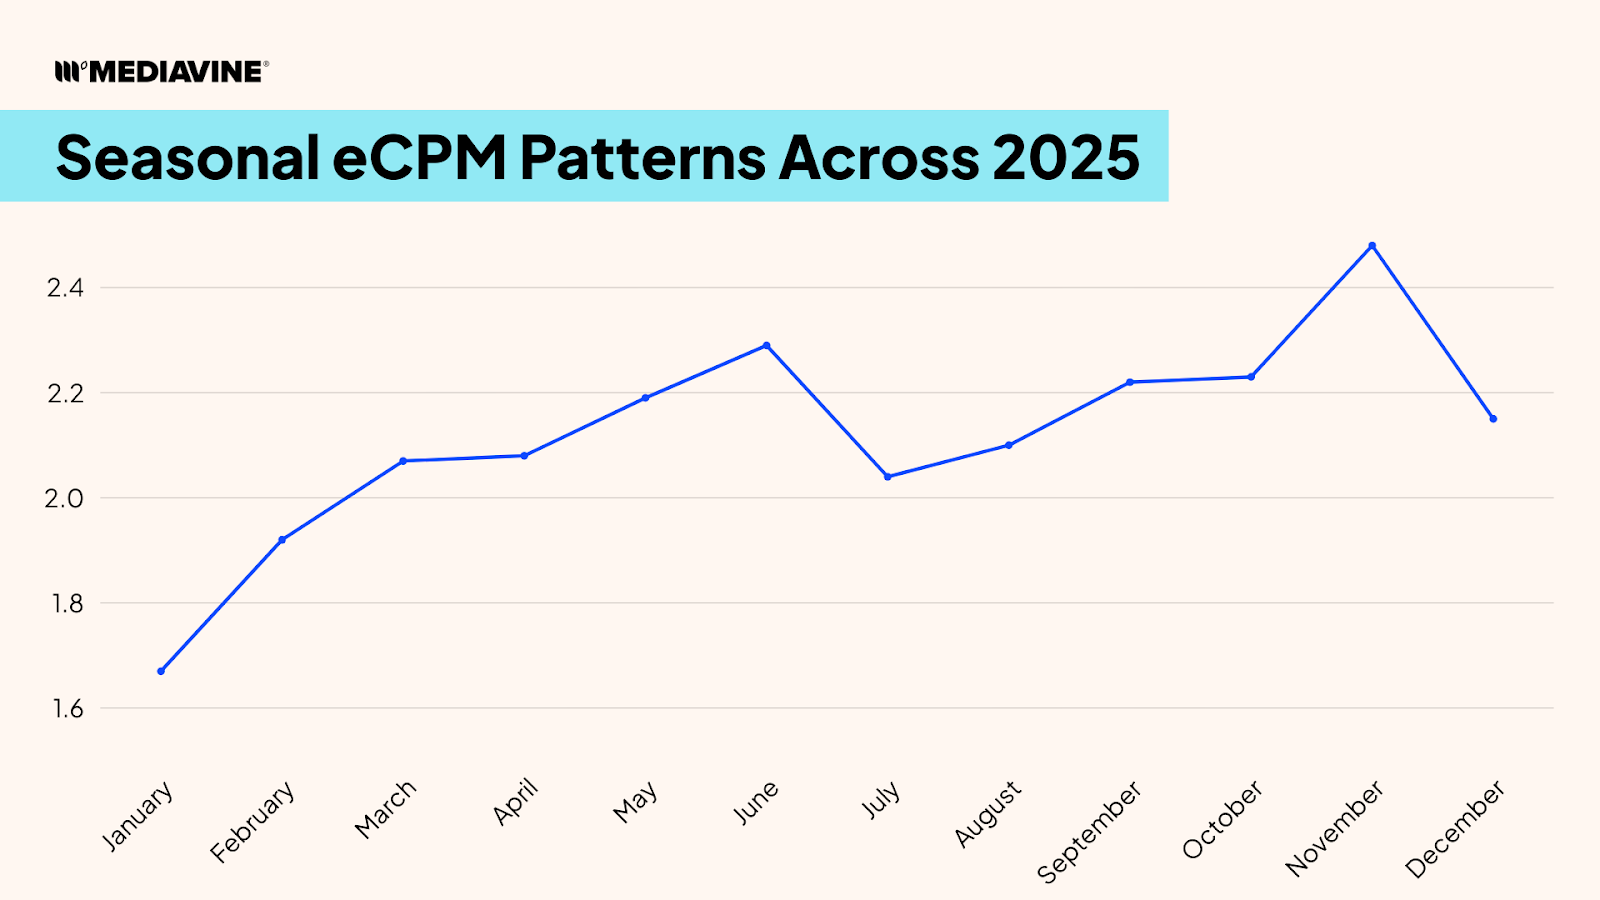
eCPMs move seasonally. Sometimes dramatically. And while it can feel random in the moment, those swings usually have very little to do with what you published yesterday and a lot to do with how advertising works over time.
The reality is this: eCPMs follow seasonal patterns. They always have. And once you understand what drives those patterns, you can stop reacting to every dip and start planning around them instead.
Let’s break it down.
eCPMs Don’t Exist in a Vacuum
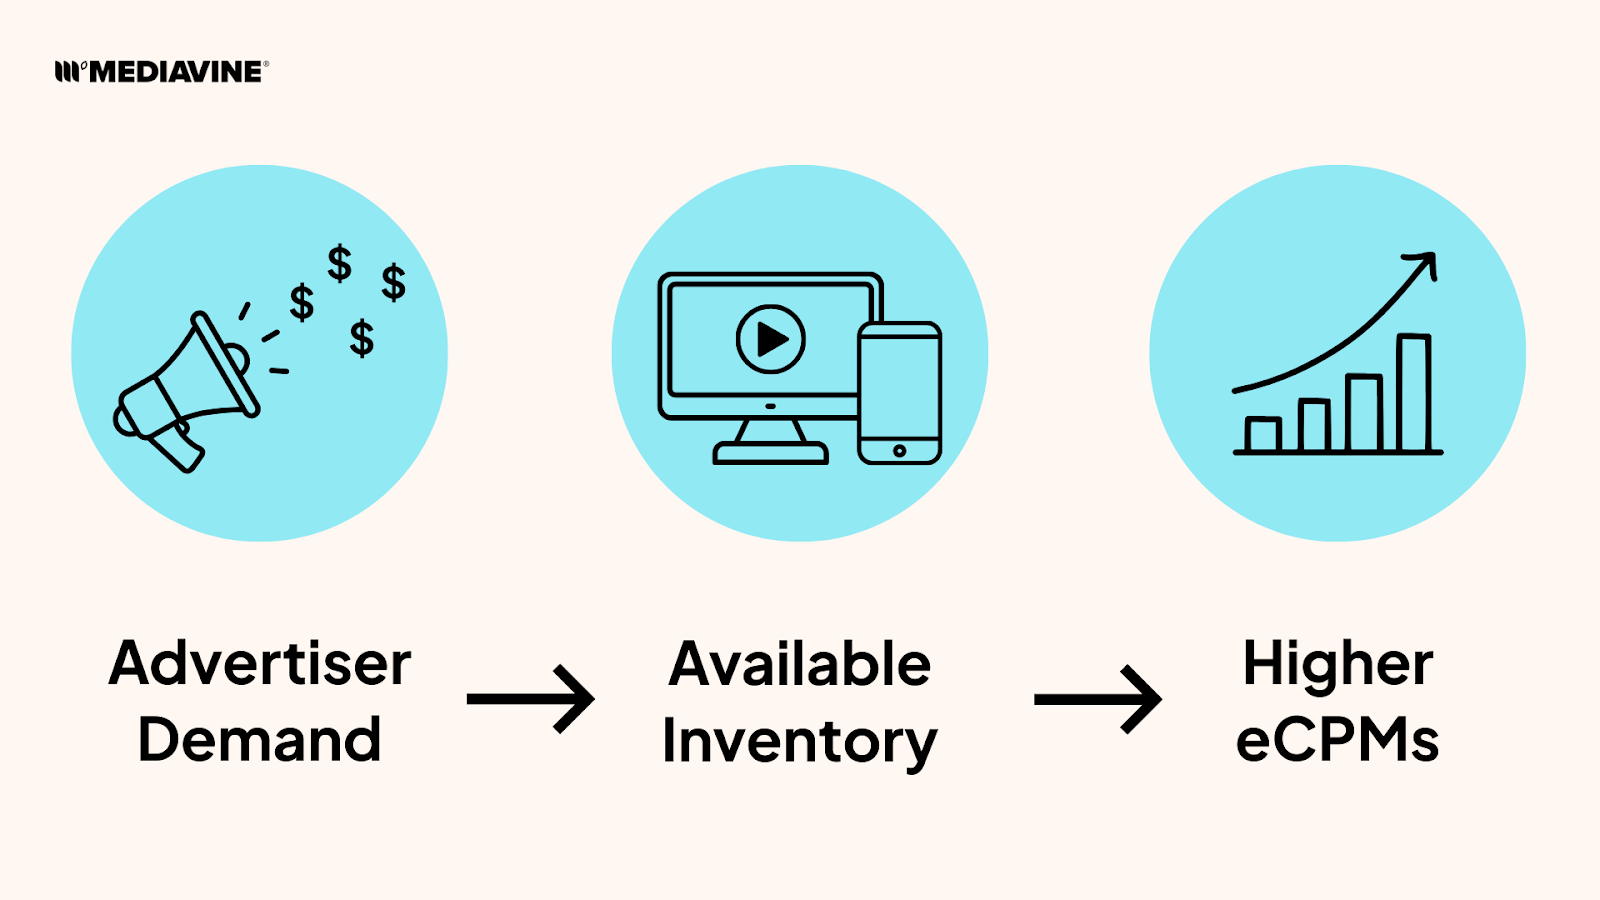
Advertising is a marketplace. When more advertisers want to reach the same audience — and the amount of ad inventory remains relatively fixed — prices go up. When advertiser demand slows, prices follow.
That basic supply-and-demand equation is influenced by a few recurring forces throughout the year. All of them are predictable.
Holidays Consistently Increase Advertiser Demand
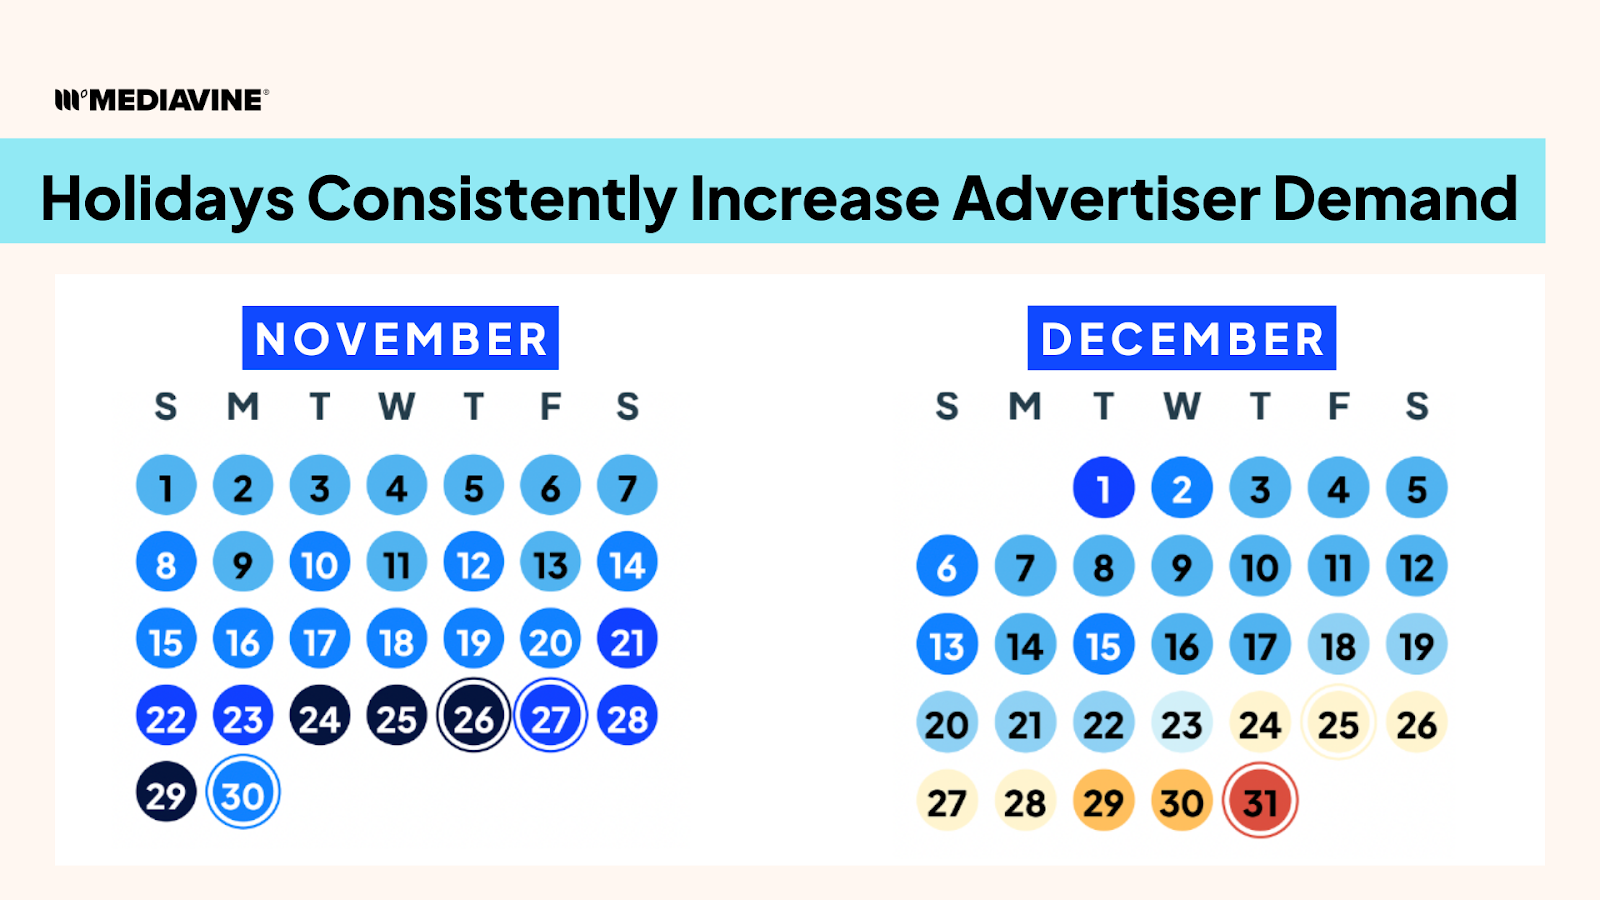
Holidays are one of the most reliable drivers of higher eCPMs. Why? Because consumer behavior changes. Around major holidays, people:
- Spend more money
- Act with more urgency
- Are actively researching and buying
Advertisers respond by increasing budgets and bidding more aggressively to reach those audiences at exactly the right moment. More competition for limited inventory typically leads to higher eCPMs.
This isn’t niche-specific, and it isn’t new. The exact holidays may vary by region or vertical, and the strength of the spikes can vary based on the broader economy, but the pattern itself shows up consistently every year.
Quarter-End Budget Behavior Shapes Performance
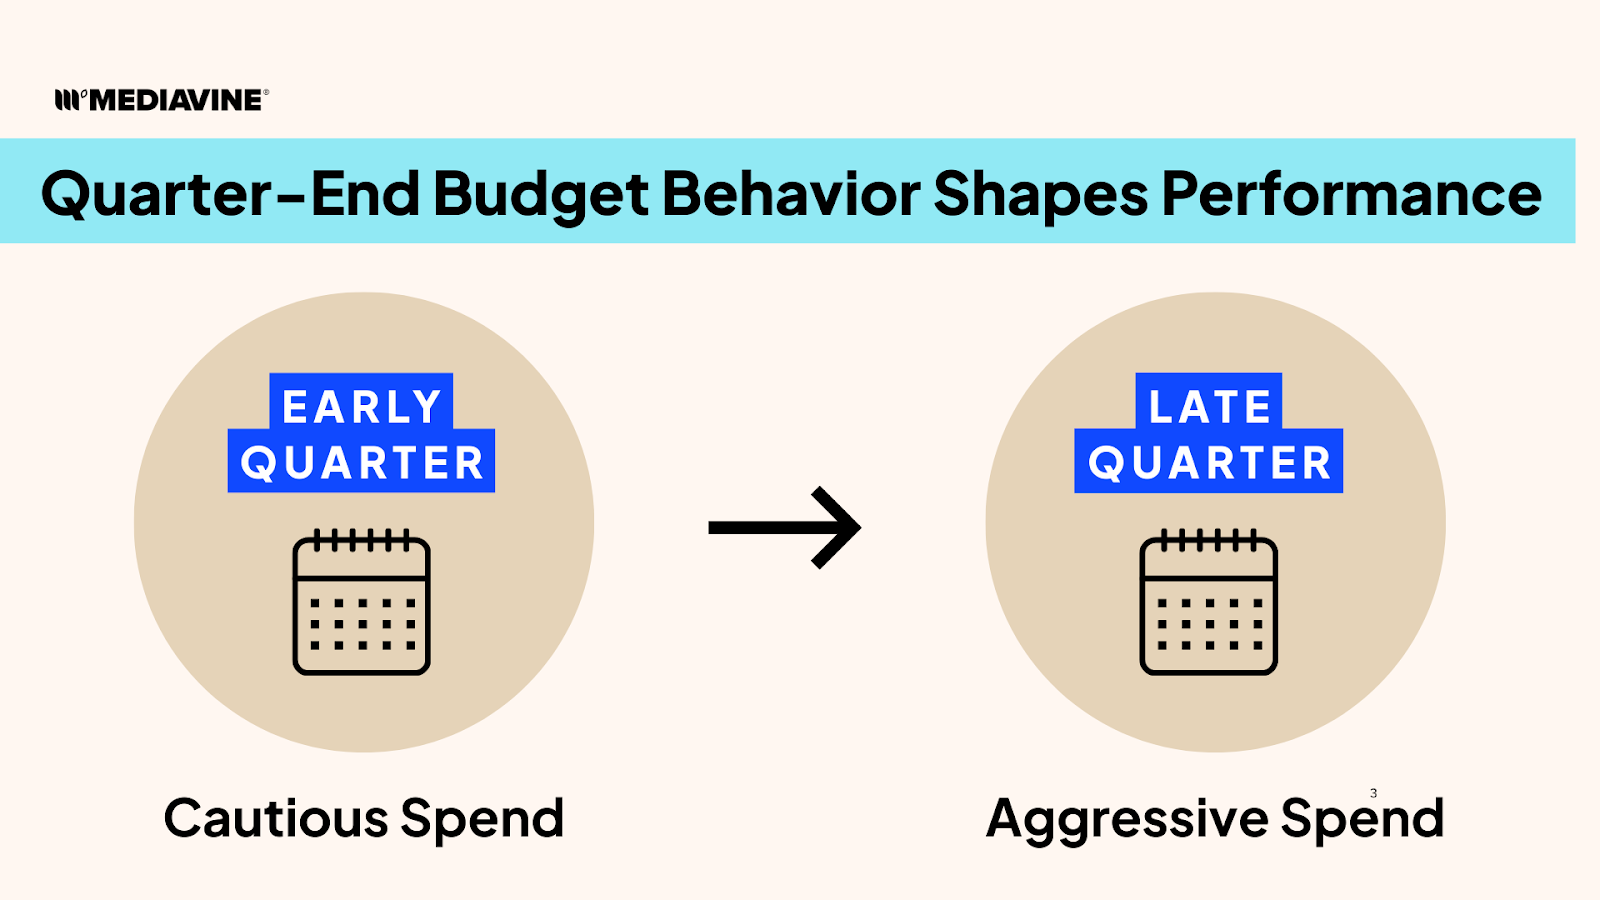
Advertisers don’t just plan in weeks; they plan in quarters and fiscal years. At the start of a quarter, spending tends to be cautious. Budgets are fresh, strategies are still being tested, and campaigns ramp up slowly.
As the quarter comes to a close, priorities shift. Unused budget becomes a liability. In classic “use it or lose it” fashion, advertisers often spend more aggressively as deadlines approach. That increase in demand puts pressure on available ad inventory, which can result in higher eCPMs toward the end of each quarter.
This is why:
- Q4 typically outperforms Q1
- Late-quarter periods are often stronger than early-quarter ones
Not Every Major Advertising Event Is Predictable
Some of the biggest shifts in ad spend each year aren’t tied to traditional holidays at all. Large-scale retail events (think Amazon Prime Day), platform-led promotions, or sudden increases from major advertisers can inject significant spend into the market with little notice. When one major player increases its budget, it doesn’t just affect its own campaigns — it increases competition for the same audience, pushing up costs across the board. That’s how an otherwise “average” day can turn into a strong one.
These events are harder to predict, but they reinforce an important point: advertiser demand is dynamic. Seasonal trends provide a framework, not a script.
The Disclaimer
Past performance cannot guarantee future results. Economic conditions, global events, regulatory changes, and market uncertainty can all influence advertising behavior in ways no forecast can fully anticipate.That said: The exact dates change. The patterns don’t. Seasonality shows up every year. It just doesn’t always look identical.
How Publishers Can Work With eCPM Seasonality Trends
Understanding seasonality isn’t about chasing perfect timing or trying to outsmart the market. It’s about making better decisions with context.
Here’s how publishers can put these patterns to work:
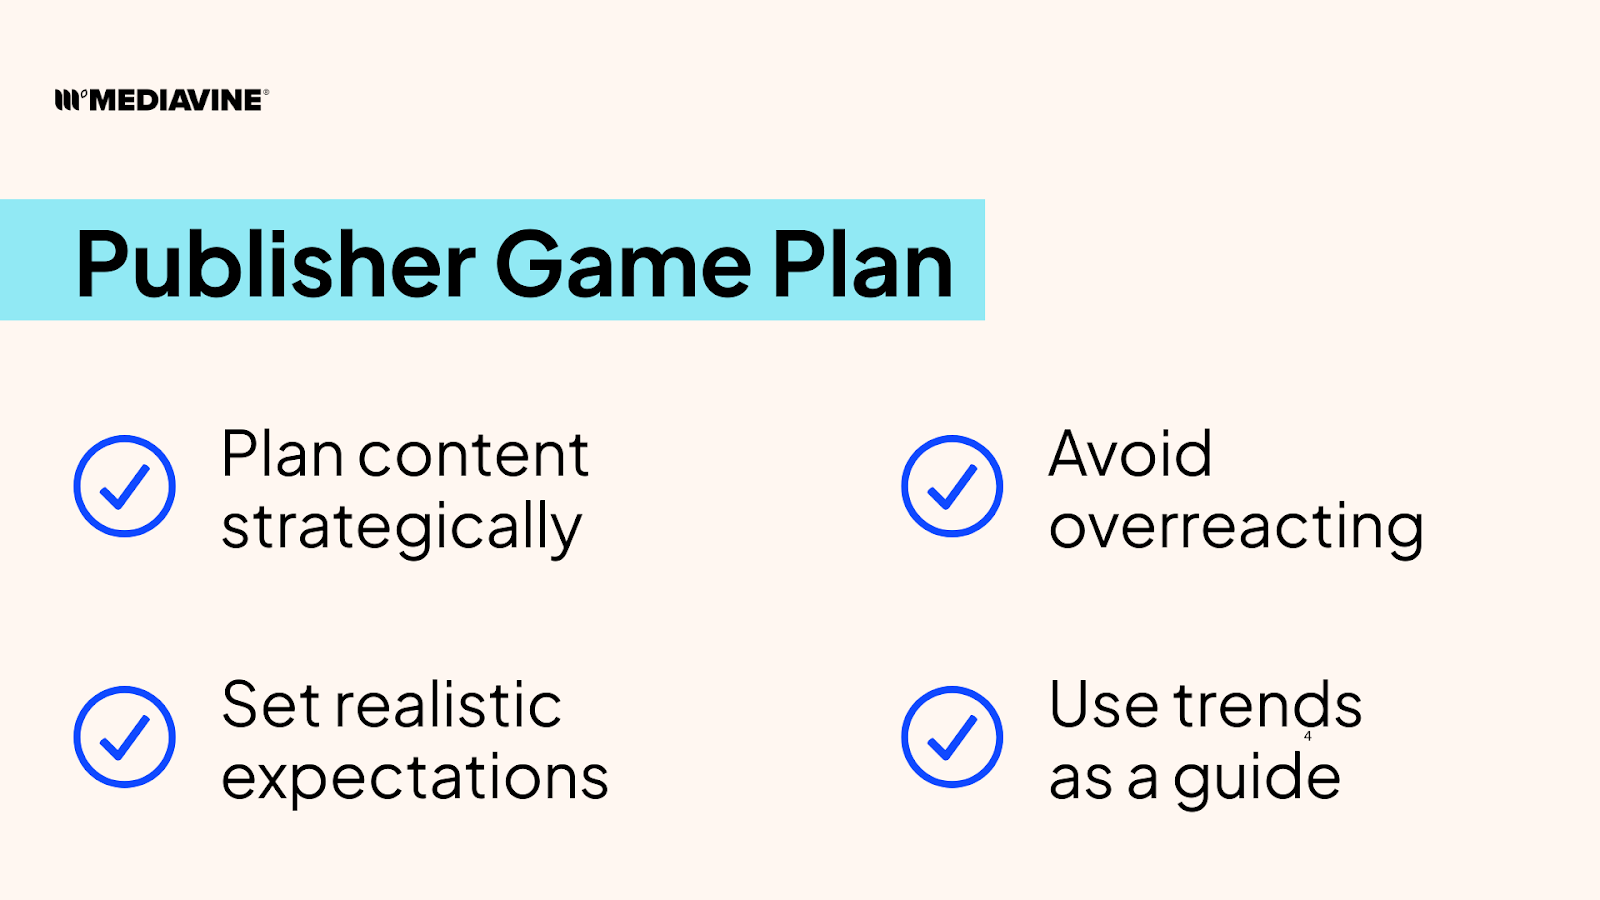
- Plan high-effort content strategically. Save your most valuable, brand-safe, evergreen content (and biggest promos) for periods of historically stronger demand. When the market bids higher, great content tends to be rewarded.
- Set realistic expectations during slower seasons. Lower eCPMs don’t automatically mean something is wrong. Sometimes it just means it’s January. And seasonality isn’t one-size-fits-all: January can be strong for health and fitness, but softer for 0pl;0-p;;l’;l/-lretail.
- Avoid overreacting to short-term dips. Seasonal slowdowns are normal. Knowing that helps prevent unnecessary “fixes” that can create more problems than they solve.
Use trends as a guide, not a guarantee. Seasonal patterns inform strategy, but they don’t replace good content, sound monetization practices, or long-term planning.
Turning Patterns Into Practical Planning
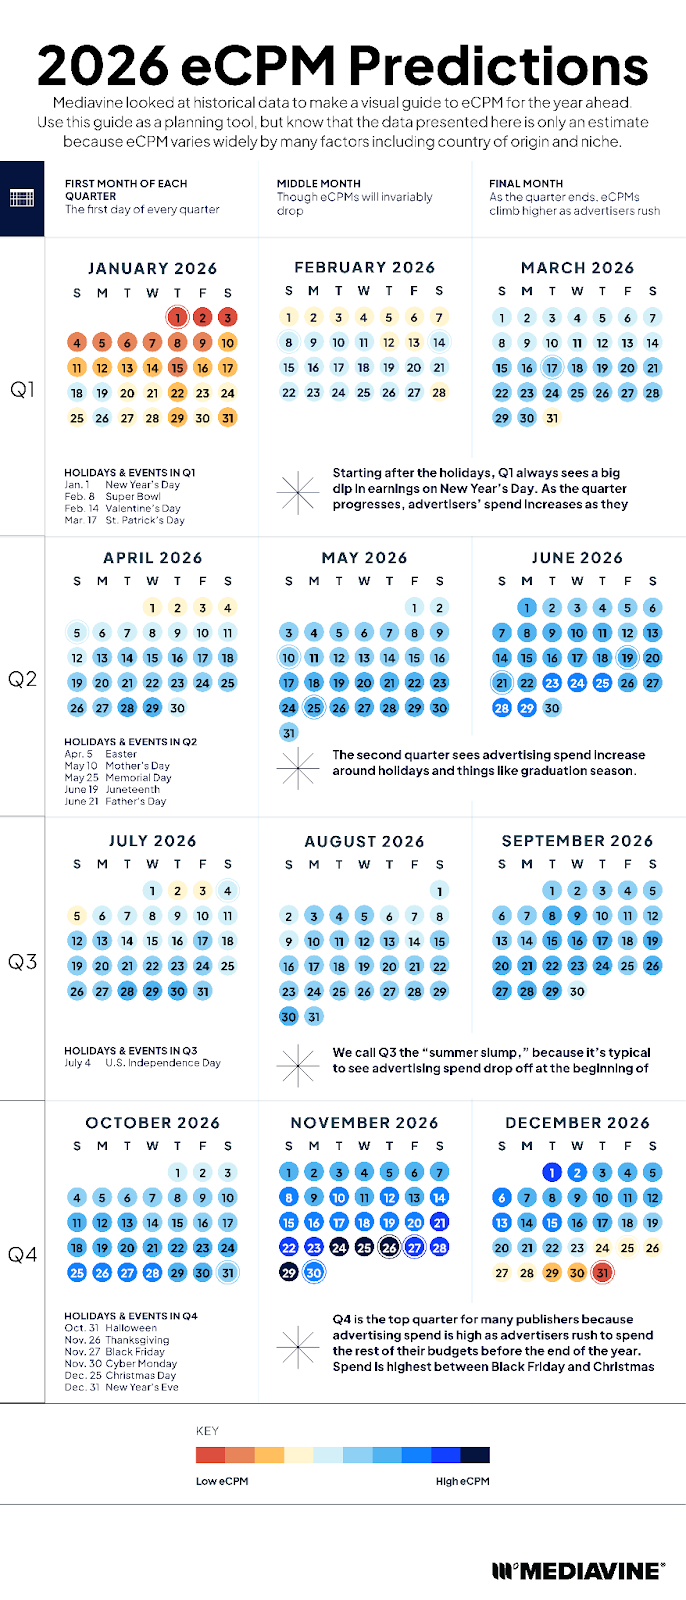
eCPM seasonality explains why ad rates rise and fall throughout the year—and why those changes are usually predictable, not random. To make these seasonal trends easier to visualize, we publish an annual “Best eCPM Days” calendar that applies historical patterns to a specific year. Think of it as a case study, not a promise.
Each annual calendar shows how advertiser behavior has typically played out across the year, based on long-standing trends. We update it annually, but the underlying framework remains the same.
Because while the calendar changes every year…
Advertiser behavior largely doesn’t.
About the author
Share this page