- Mediavine
Google Helpful Content Update: What Our Data Shows
•
Post updated on October 18, 2023.
Let’s talk about the elephant in the internet: Google’s September Helpful Content Update.
We turned to the data available to us across more than 10,000 sites to try to determine the volume of impact and potential causes for why some sites were hit by this update.
It’s important to note that we’re bringing you this data now — as opposed to two weeks ago — because we needed to allow some of the dust to settle. Running these numbers while the update was ongoing would have given us incomplete results and it takes time to analyze the data and pull it into something shareable.
Let’s get to it, shall we? Warning: Numbers ahead.
How Many Sites Were Affected by the HCU?
Of the 10,302 sites represented by Mediavine ad management — as of the writing of this article — 607 were identified as having been negatively impacted by Google’s Helpful Content Update.
That’s 5.8% of sites.
We also discovered 1,170 sites which saw positive increases to their Google referral traffic coming out of the HCU.
We know being part of that 5% feels huge to those whose sites were significantly impacted. But knowing whether or not your traffic decline is due to the HCU or is an organic decline over time helps us — and you — plan the next steps.
So, how are we defining “significantly impacted”? Glad you asked.
Our HCU Methodology
We started by looking at traffic across Mediavine publisher sites from the start of Q3 (so, July 1). Once we had start and end dates for the Helpful Content Update, we excluded those dates from the report. This was important to get clean data since the rollout was progressive across sites.
We also looked at other sources of referral traffic and identified sites whose overall traffic from all sources had been on a steady decline since before the start of the HCU. The indication in those cases is that, while Google referral traffic may have gone down, the update wasn’t the primary cause.
Then we looked at the percentages of traffic increases and declines and grouped them like this:
- No Change
- Increase (greater than 5%)
- Decline between -5% and -20%
- Decline between -21% and -50%
- Decline less than -50%
In this case, “less” means more decline since we’re moving to the left on the number line.
(Confusing, yes, but our data analysts assured me this is accurate. And trust me, I asked if they were sure.)
From there, we filtered out sites making under $100 per week in gross revenue, not because these sites aren’t important, but because comparing a 50% decrease in revenue on a site making $100 is vastly different from a 50% decrease on a site making $10,000.
Both are 50%, and yes, both publisher groups matter tremendously. But the data sets can’t be compared fairly.
Now let’s talk about revenue, because a drop in traffic should equal a drop in revenue, too, right?
How Has the HCU Affected Revenue?
Across our publisher sites, we’ve seen around an 11% decline in referral traffic from Google, but we have not seen a corresponding decrease in revenue. Revenue remains at a net 0% change, most likely due to the HCU timing.
Since it coincided with the end of Q3 and the beginning of Q4, advertisers were already primed to increase their spend, and what the data shows is that many sites which lost Google referral traffic gained traffic from other sources, like Pinterest or Facebook, or even from other websites.
In fact, 40 of the 607 sites mentioned above experienced a positive gross revenue change despite a decline in traffic coming from Google.
Which Niches Were Affected by the HCU?
One of the questions we’re asked most often whenever we’re asked about data is “which niches are ____.” Insert anything from “most profitable” to “impacted” in that blank.
It may look as if lifestyle niches were most impacted, but that’s because lifestyle categories dominate Mediavine’s inventory. These are the results we expect to see here.
With that said, the breakdowns for the top 10 niches affected — positively and negatively — are as follows:

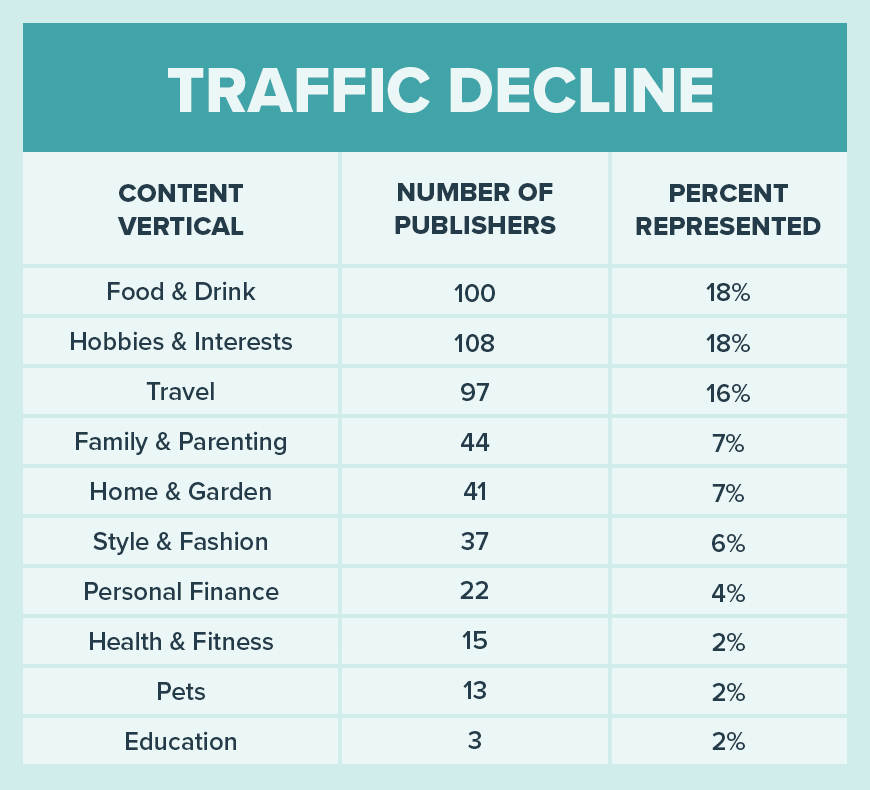
There are times when we can say, definitively, that some niches are hit harder than others.
Travel sites following a pandemic, for instance.
This is not one of those times.
The top three niches across both positive and negative impact groups were the same and represent three of the four most high traffic niches on the internet.
There’s not a lot of evidence to support a claim that sites in certain niches were impacted more heavily than others once we acknowledge that the most heavily impacted niches are also the most abundant.
Are Higher Ad Density Settings Related to the HCU?
Based on the data available to us across more than 10,000 sites, we do not have any reason to believe that sites running more Mediavine ads — or fewer — were more heavily impacted by the Helpful Content Update.
The data about ad density and the HCU is pretty agnostic.
Sites running all configurations of ad density settings were impacted, and sites running recommended density settings were impacted at the same rate (12%) across both Desktop and Mobile settings — even while representing 54% and 93% of publishers respectively.
Let’s talk about ad density for a second.
Ad density, according to the Coalition for Better Ads, is about density rather than quantity. This means that the number of ads served on your site should be relative to the length of your content.
If your content is short, you’ll serve fewer ads. If your content is longer, you’ll serve ads proportionate to the length of your content.
Our recommended ad density setting for Mobile is 28% (20% on Desktop). The CBA recommends a 70/30 split between content and ads, and our recommendation for Desktop in-content ads is actually lower than CBA suggestions because it provides a better user experience.
No matter which frequency you choose in your Mediavine Dashboard, we will never run more ads than your content can support, on Desktop or Mobile.
Your readers and your revenue are our top priorities.
So, What Do We Do Now?
In short, nothing drastic.
It’s Q4.
We’re still learning about the HCU and monitoring its impact, just like the rest of the industry. Plus, there are two additional updates running concurrently right now.
Now is not the time to adjust ad density settings because ad spend is ramping up. And when you change something like the number of ads you’re serving — especially if you’re lowering your density because someone without data claims too many ads are the cause of your troubles — you’re hurting your earning potential from all the other traffic sources out there.
Google’s blog on what constitutes helpful content and how to evaluate your site is a great reference, but it requires evaluating your content objectively. Sometimes, we’re just too close to our own content to be able to evaluate it effectively.
This is where content optimization tools or mastermind peer groups can come in handy. Letting a tool or another human you trust give you unbiased feedback can eliminate some of the difficulties we experience when editing and evaluating our own content.
When updates like this happen and your site is impacted, it’s natural to want to know why. No one wants to see their hard work vanish overnight.
Unless Google itself says “we hit your site,” and provides a reason, a lot of the evidence being presented for why some sites were impacted is anecdotal, reminding me of an important phrase in statistics: correlation does not imply causation.
We have a dedicated team who will continue to monitor and diagnose the HCU and other updates, and we’re looking deep into our data to see if there are any definitive commonalities across sites.
Update:
Regarding the exclusion of sites making under $100/week in gross revenue before the HCU: That $100 gross revenue per week refers only to revenue coming from Google traffic. Some sites are absolutely killing it at Pinterest referral traffic with almost none coming from Google.
We initially reported this in a way that indicated we had excluded all low-revenue sites, which wasn’t the case, and we apologize for the error.
In our analysis, we controlled for declines in Google referral traffic against referral traffic from other sources.
In trying to isolate whether Google’s HCU was the cause for a site’s traffic decline, we have to exclude sites whose traffic from other sources is either increasing/holding steady or declining slightly (up to -10%) during the same time frame. Otherwise, we’re just reporting on a site’s overall traffic decline and not the Helpful Content Update specifically.
In the spirit of being thorough, we ran the data again and adjusted for publishers whose referral traffic from other sources was declining but whose rate of HCU traffic decline was at least two times greater.
That brought us to 795 publishers with a negative traffic impact. We also examined the way that Google Discover traffic reports through GA4 and found another three publishers impacted, which brings us to a total of 798, or 7.7% of Mediavine publishers.
Next steps for us? Looking at commonalities to try and determine connecting factors, keeping in mind that correlation does not mean causation.
About the author
Share this page