Ad Settings
Rocking the Mediavine Dashboard: Reporting


Data is complicated.
If there’s one thing I learned in my college statistics class, it’s that.
Before I ever worked here, I was (and still am!) a publisher for my site Feast + West. From the first days I was with Mediavine for my ads, I have loved the way they make complex data easy to understand.
The multi-faceted reporting and customizable settings available in the dashboard are unmatched. With other ad management companies, I had never seen anything this detailed.
After more than a year in Publisher Support and now as part of our Marketing team, I see the value in our dashboard more than ever.
From settings you can change to help you earn even more, to reporting that gives you a top-down view of how well your ads are doing, the Mediavine dashboard (which got a BIIIG upgrade in summer of 2020) is pivotal to a publisher’s success with their ad revenue.
Whether you are considering a switch to Mediavine or are a current publisher who hasn’t spent a lot of time in your dash yet, this post is for you.
We’re giving a behind-the-scenes tour of our dashboard in a two-part series.
First we’ll cover the reporting side of things, to help you understand your ad income and explain what all those numbers, percentages and graphs mean. Then in another post we’ll delve into the various settings and tools you can find in your dashboard, all to help you maximize your earnings.
Let’s start by breaking down the main reporting page, section by section.

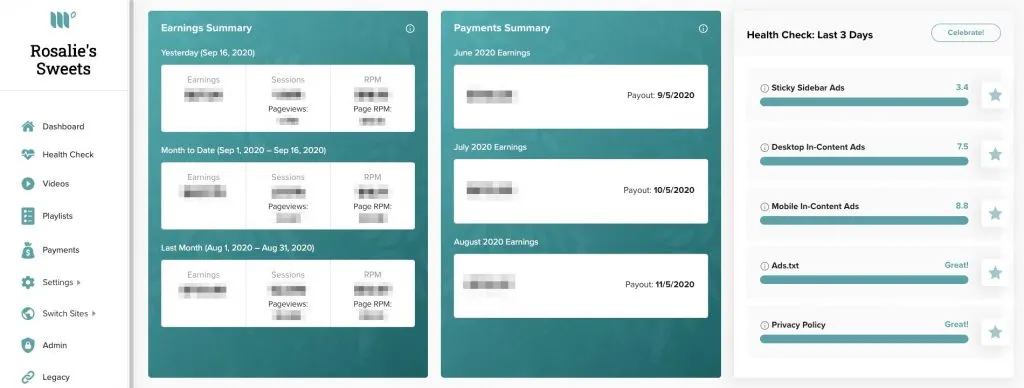
The first piece of information in your dashboard is your earnings data. In the first widget on the left, you’ll see the amount you made yesterday. What you see is what you get.
You can also track your month so far and compare to the previous month.
Important note: This data updates by 10 a.m. EST each calendar day, so if you are checking before then, DON’T PANIC! Your earnings from the previous day have not been configured yet.
Next is arguably the best part! Your payment schedule so you can count the days until your earnings will hit your bank account. All payments are NET 65, and we have a handy payment schedule you can bookmark.

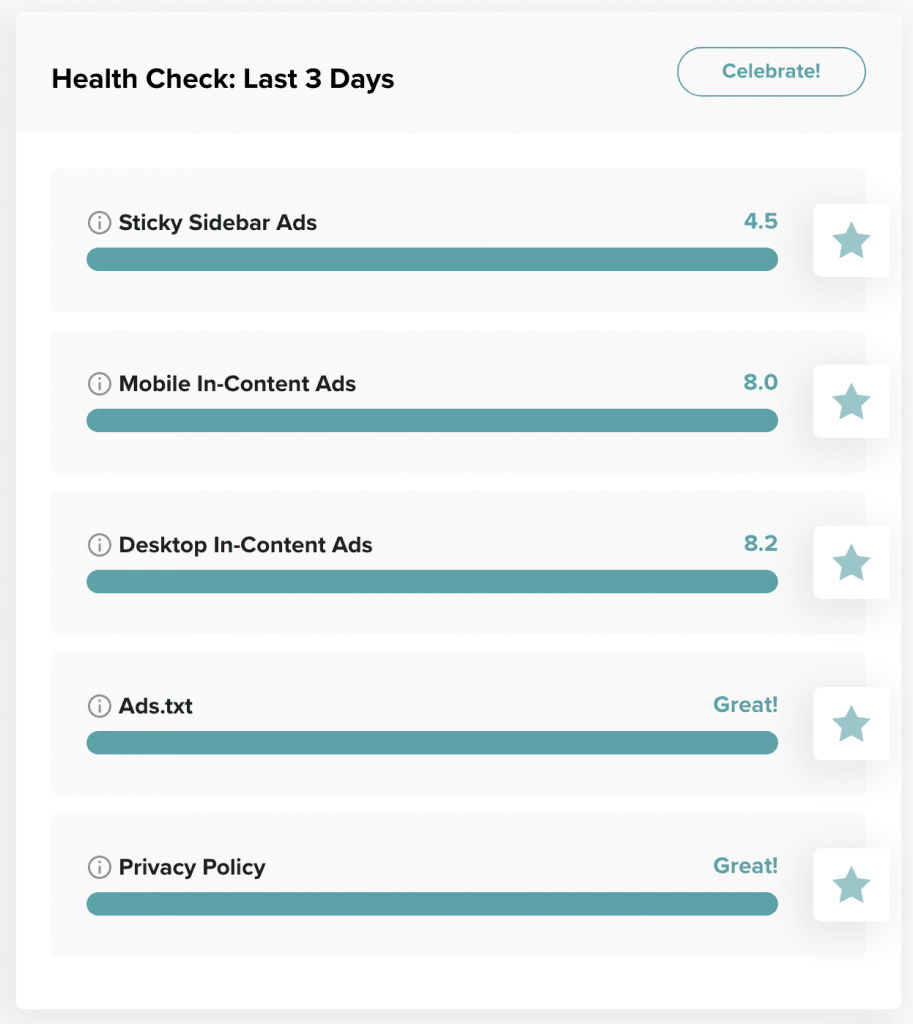
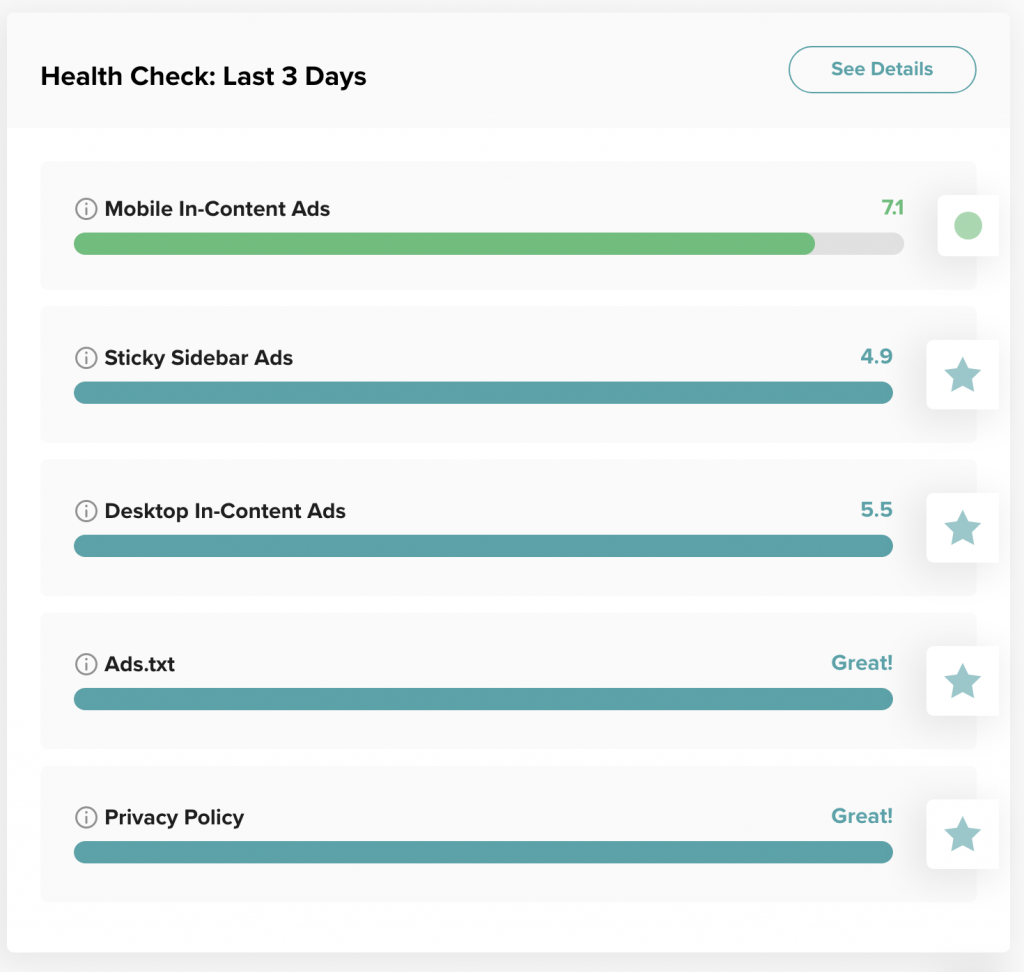
The fourth piece of this dashboard view is the site health check. Here you’ll find five items that are common spots for improvement.
The first three lights help you track the performance of your top three ad units — your sticky sidebar ad and your in-content ads on desktop and mobile. These are designed to give you a good picture of how well your ads are earning in comparison to the amount of traffic you’re receiving.
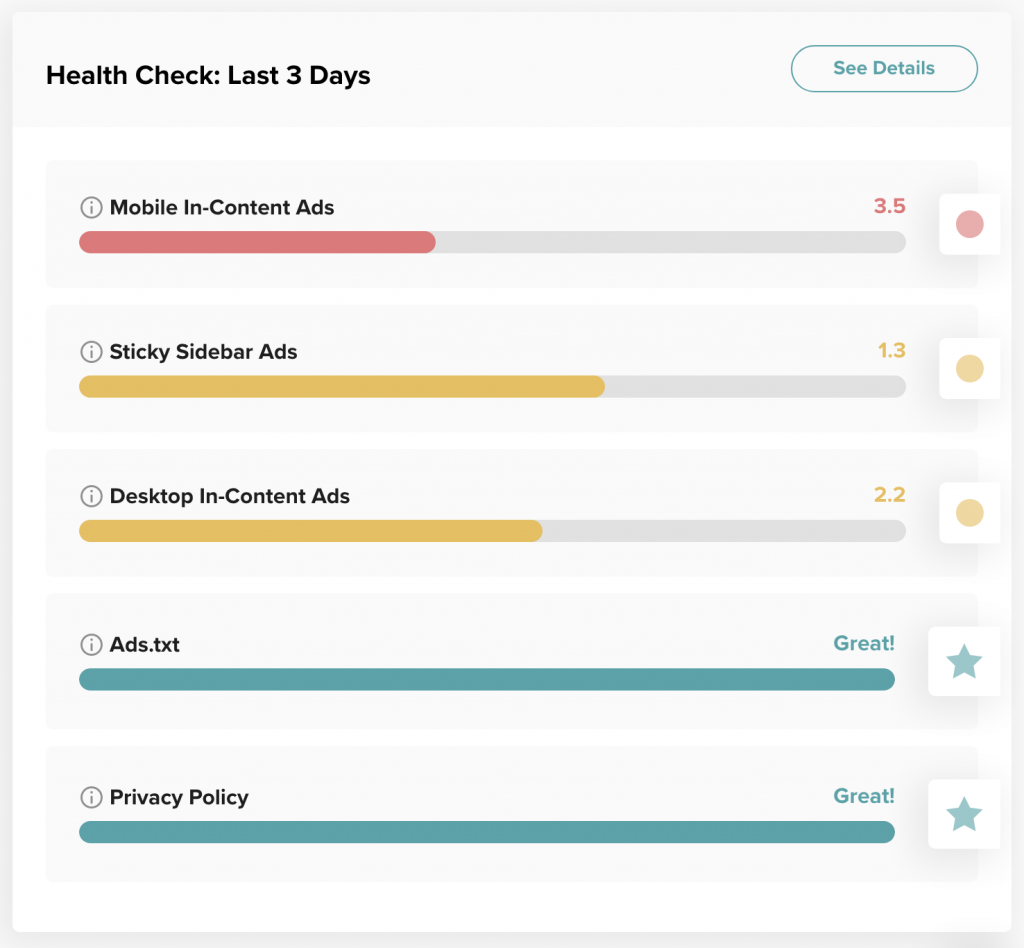
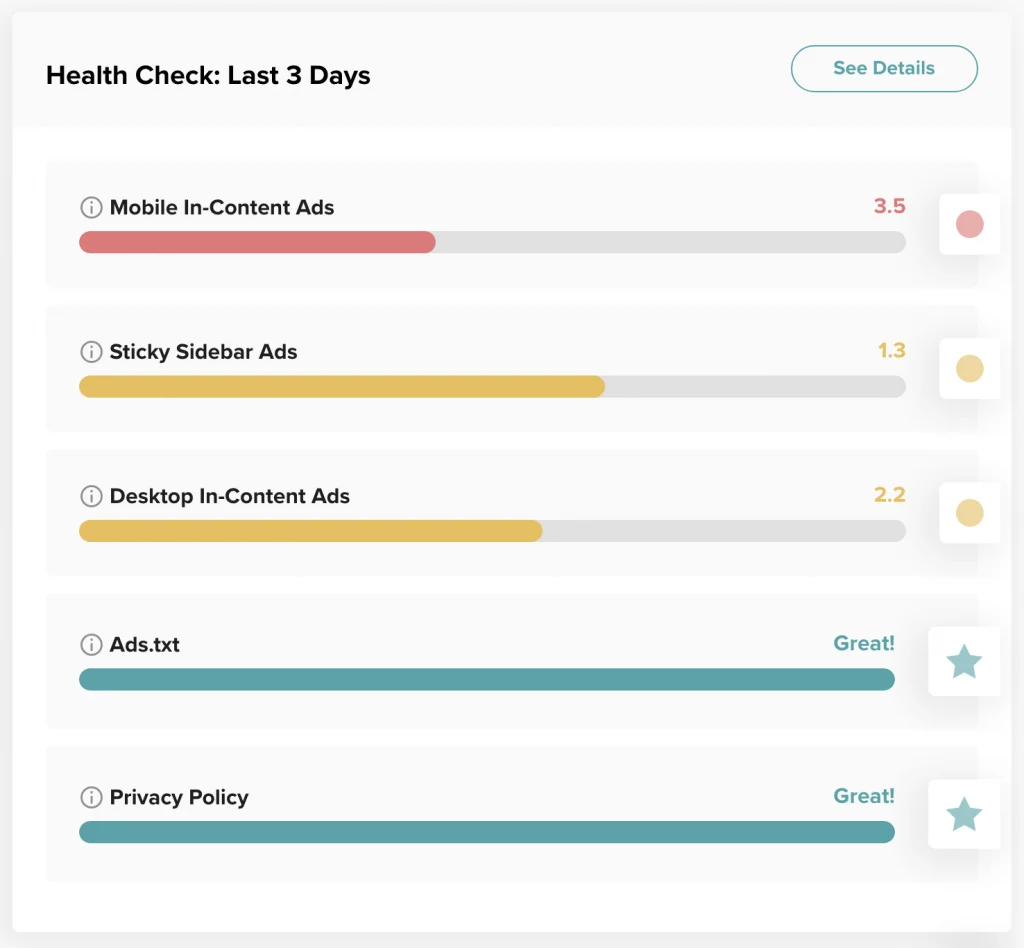
The most important thing to remember about your health check lights? They’re based on the last three days of traffic ONLY, so a change in lights can mean that something changed with the traffic to your top pages, and therefore the way ads are performing on those pages.

We have tons of resources for working on your site health lights. I love this post about optimizing your posts for ads and SEO and this guide to conducting a 20-minute self-audit is awesome if you don’t know where to start.
Remember that changes you make will take around three days to affect the lights, because we need three full days of data with the changes in place to understand how they impacted your ad performance.
The other two lights are for your ads.txt file and your privacy policy. These lights help you know when these are in place and functioning correctly, or if they need to be updated. The ads.txt file can affect your earnings, so it’s definitely one to watch and update ASAP. Here’s how.
If something ever seems amiss with your ads, don’t hesitate to reach out to us at publishers@mediavine.com or by clicking the teal chat bubble in the bottom right of your dashboard.
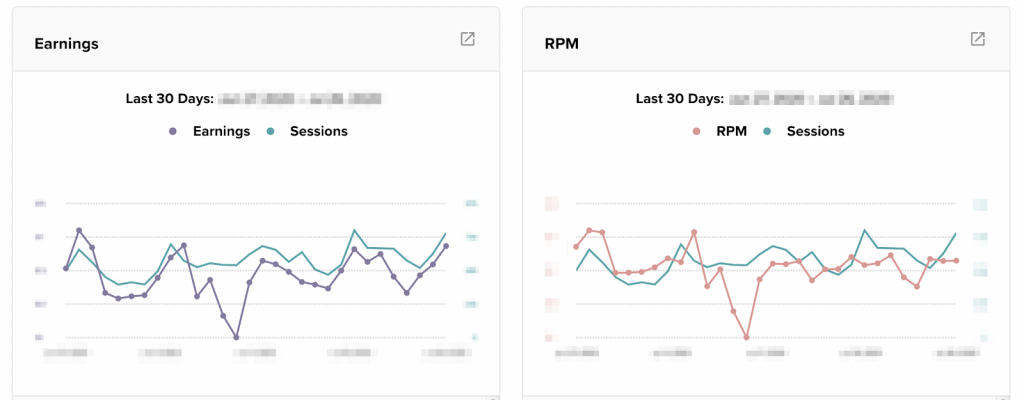
This section helps you get into the nitty gritty of how well your ads are performing. You can compare your sessions to your earnings in these two graphs.
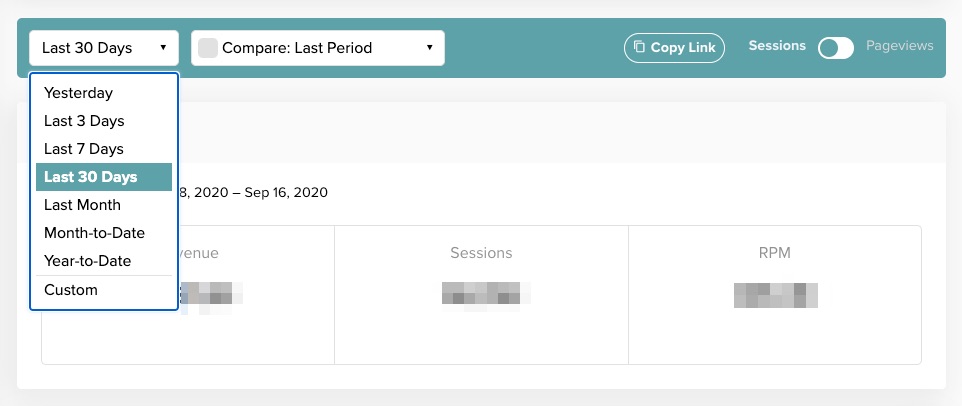
One place to start is to use the Select Date Range selector to narrow down your dashboard to a particular day or range, and see if there are any clues in your top posts, or ad unit reporting. More on those in a sec!
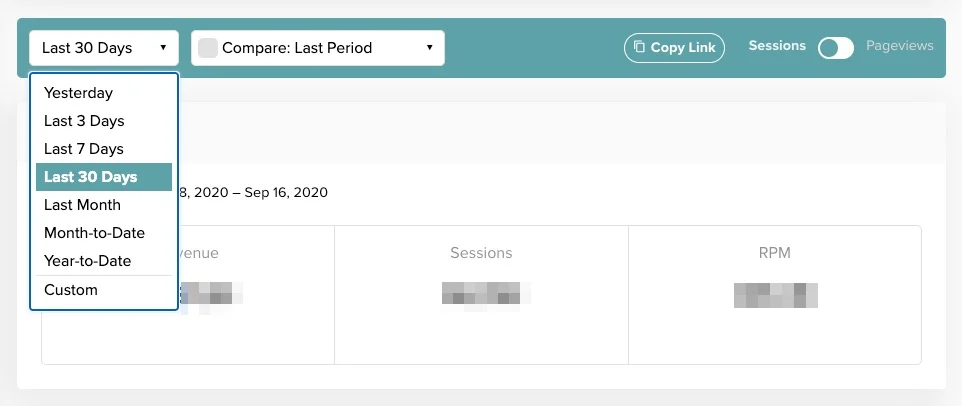
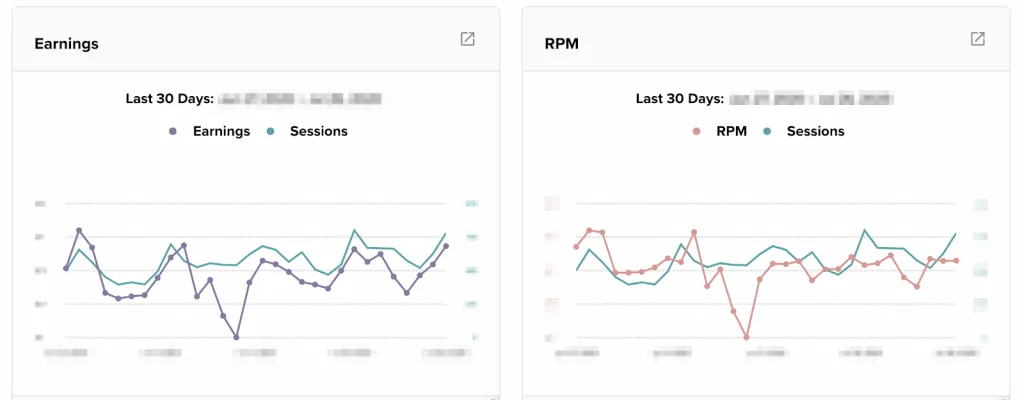
If you see a drastic drop in RPM and earnings like this publisher did in the screenshot above, that’s definitely a reason to reach out to us.
We run reports daily to keep tabs on all of our publishers’ performance and we will reach out if we notice something is wrong, but if you notice first, please don’t hesitate to get in touch.
If you have any additional earnings, such as payments for sponsored work or credits for outages, they will appear in the Revenue section.
Outages don’t happen often, but when they do, you have our promise we’ll handle them with transparency and do our best to make it right.

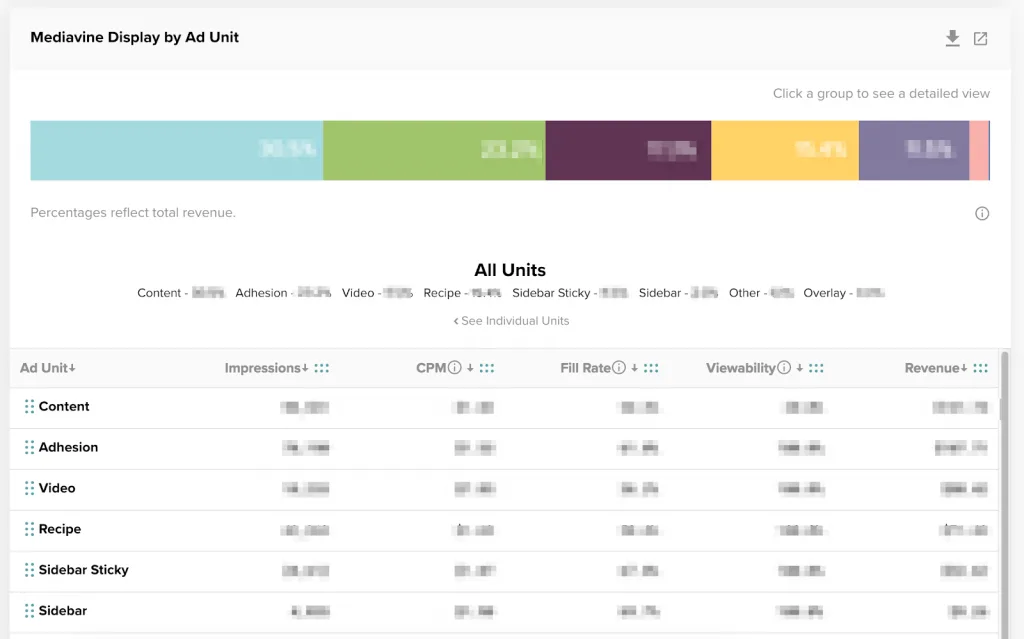
This part’s pretty neat! You can see how each unit is performing on your site in terms of number of impressions and revenue, but we also go deeper with even more data.
If you want to learn more about any of these figures, we have some awesome blog posts and videos that explain how they’re calculated. Learn more about CPM, fill rate and viewability.
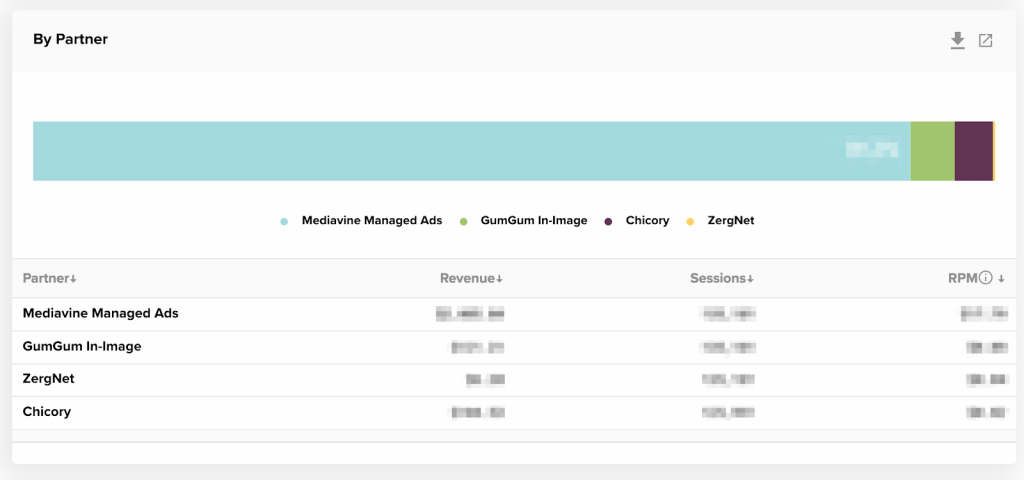

If you are running any of our third-party partner ads — such as the ZergNet traffic exchange, GumGum in-image ads or Chicory ads — earnings and RPM for those units will show here. You can compare how those are doing in comparison to your Mediavine ads as a whole.
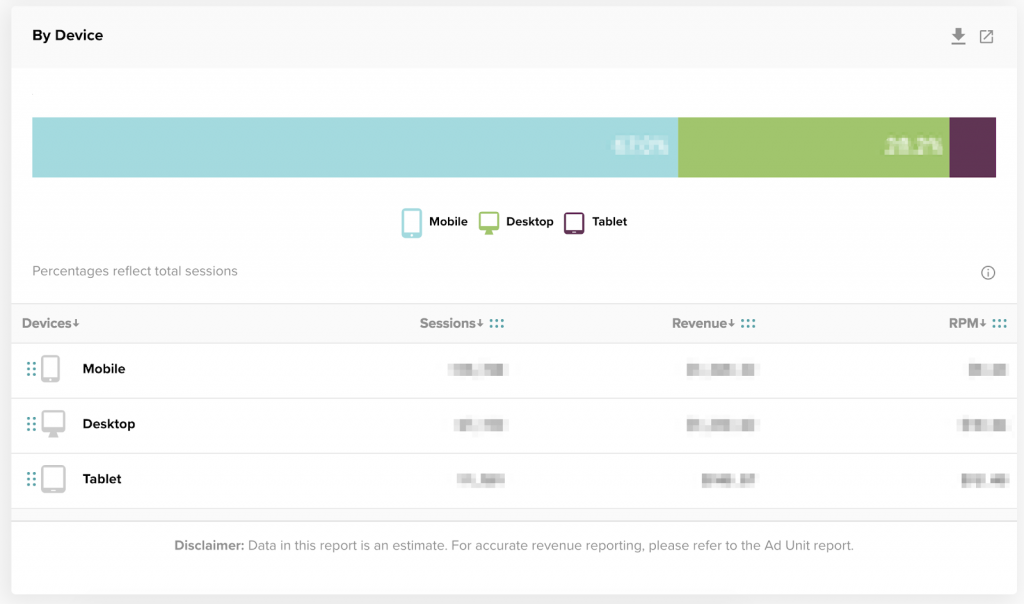
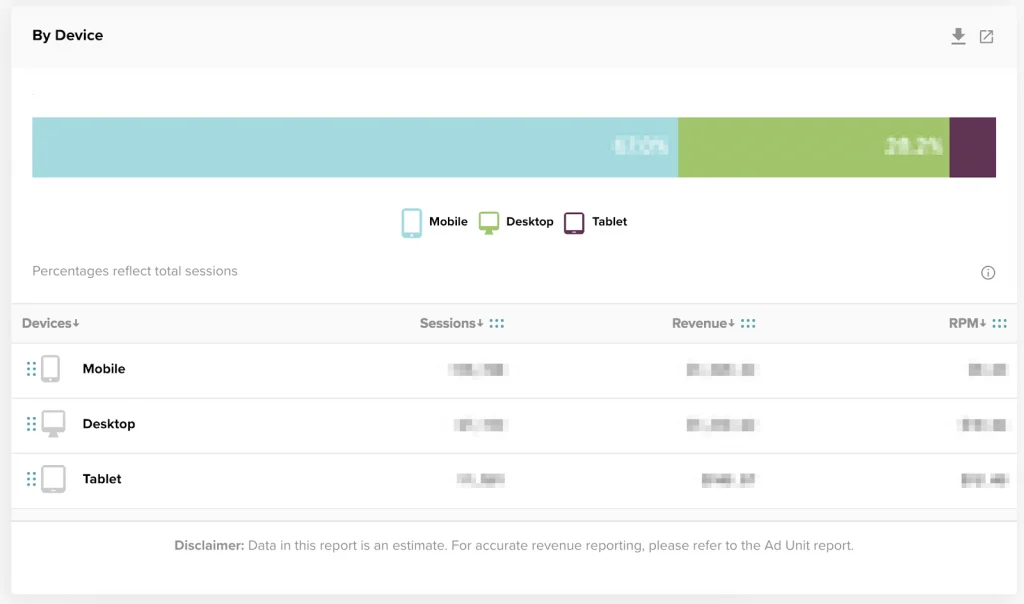
We use data pulled in from your site’s Google Analytics (which we help you connect at launch) to show you how your traffic is allocated by device. This is helpful info when trying to make sense of how your ads are optimized.
For me, the data helped me answer the question, “Do I really need all that stuff in my sidebar when I have a HUGE portion of mobile traffic that won’t even see the sidebar on a smaller device?” (The answer was no, I did not need it!)
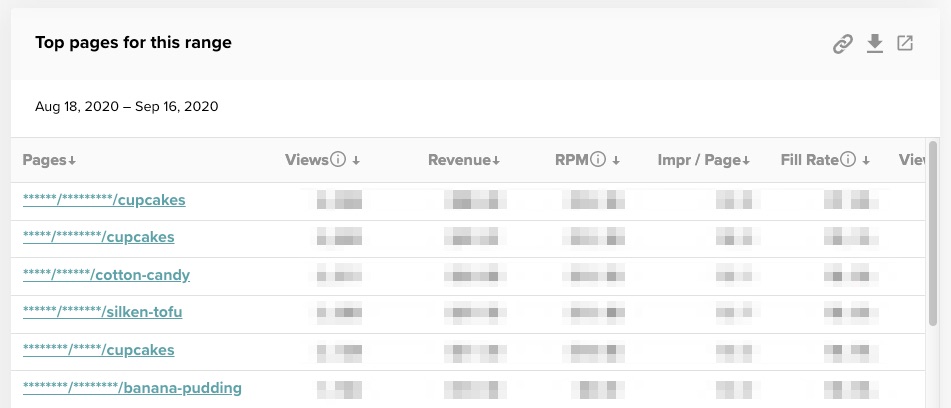
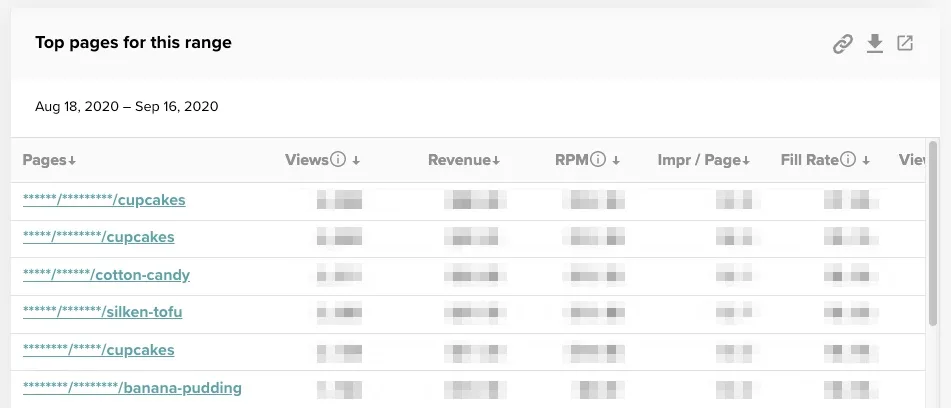
These are also filtered in from your Google Analytics. If you’re tackling your site health lights to get up to green or to go for teal, then we recommend narrowing your dashboard dates to the last three days and looking at your most recent top-performing posts in this section.
That time period will help you get a good picture of what posts are your #1 moneymakers, and where to narrow your focus for optimization.
If you are using our video feature (and if you have video content on your site, you should be!) your earnings for each video file you upload will show here, in order of revenue. All earnings for all of our video units are calculated into these numbers.
Have videos but have yet to try one of the Mediavine video offerings because you’re not sure how? No problem! Here are our guides for setting up your videos with our Mediavine video player, our video adhesion unit and our beta sticky desktop player.
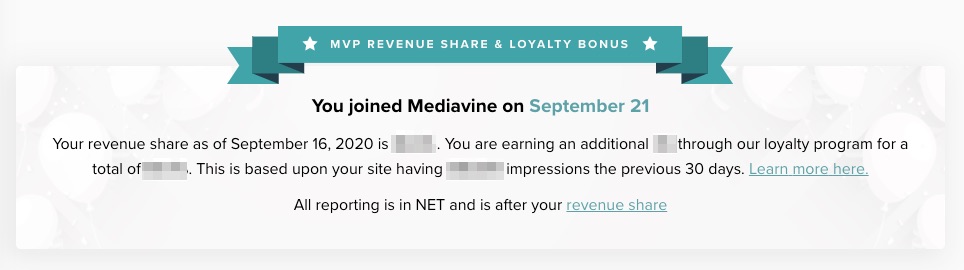
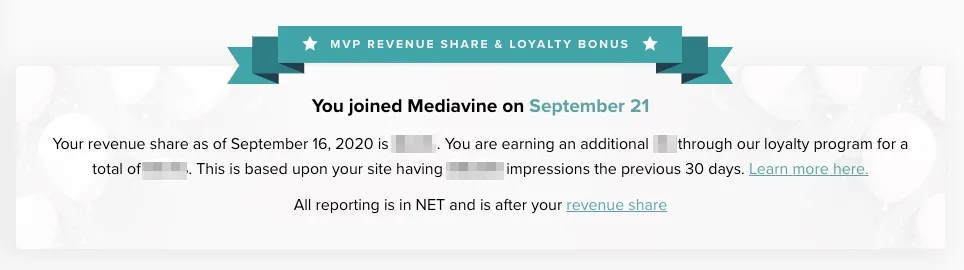
At the bottom of your dashboard homepage, you’ll find the anniversary of when you first launched Mediavine ads on your site as well as your loyalty bonus.
The loyalty bonus is 1% added to your revenue share each year, up to 5%. This means you can earn up to an 90% revenue share, when you’re hitting our impression-based goals and reach your 5 year anniversary. It all starts with our 75% minimum revenue share and grows from there.
That’s it! I hope you enjoyed this tour of our dashboard reporting, and maybe learned something new! Next we’ll be covering your dashboard settings, and using all of the tools available to you to make more money.
We’re always here to help so don’t hesitate to reach out if you have questions!
Stay up to date with the latest from Mediavine

 Heather Tullos
Video ads are an important part of the monetization strategy for your website, but the options can be endless, and some options can completely destroy your user’s experience. So what’s …
Created in 2004, but running ad management services since 2015, Mediavine is the largest display ad management company in the world, working with nearly 9,000 independent lifestyle website publishers, helping …

 Eric Hochberger
As you know, Mediavine recently brought back the mobile interstitial for a second act after its unspectacular debut a few years ago. Now, as promised, we’ve launched its desktop counterpart …