- Advertising
How Does Mediavine Stack Up? — Behind The Numbers with Brad
•
From the simplest “set it and forget it” options, such as Google AdSense, to a company like Mediavine, which offers full end-to-end solutions for content creators, there’s no shortage of options when it comes to ad management.
In any marketplace with a wide variety of choices, a business is inevitably asked the following question: How do you perform compared to others in the industry?
We’ll attempt to answer that as it pertains to online advertising in this latest edition of Behind the Numbers with Brad. (Is #BTNWB trending yet? No? Maybe next edition.)
Looking back on industry trends from 2020 and early 2021, and comparing it to the average performance of Mediavine websites to see how we stack up, is an interesting exercise.
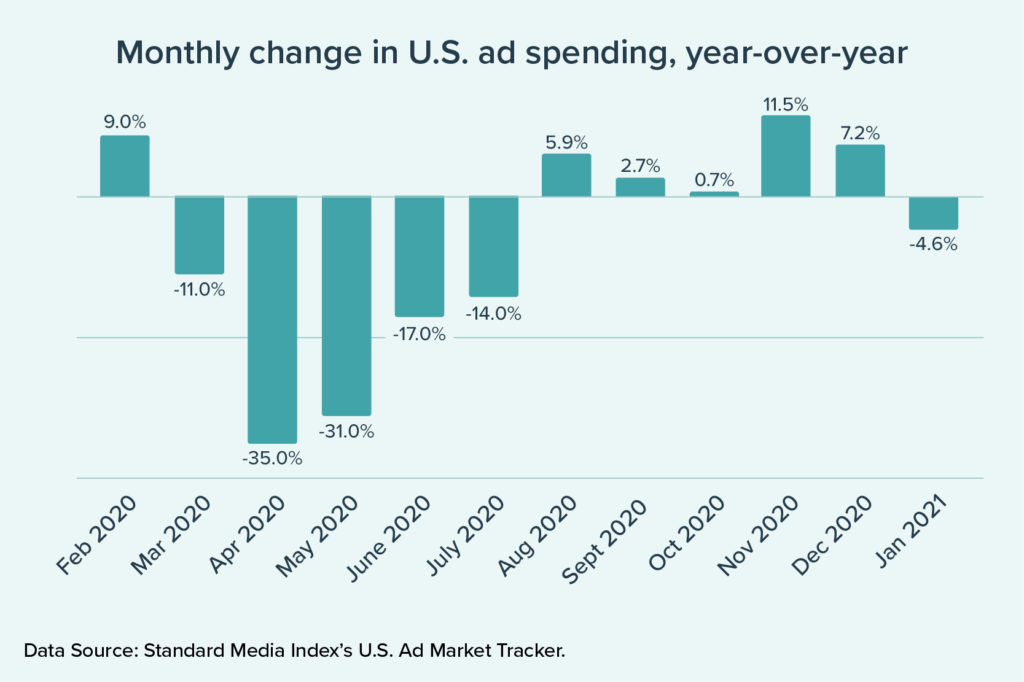
A recent article published in Mediapost documented the monthly change in digital advertising spending in the U.S. over these unprecedented last 12 months.
The trends are not overly surprising and tell a story of an economy that has been through the uncertainty of a pandemic, a recession and a recovery mode in a year’s time.
For comparison, let’s look at Mediavine publishers’ average RPM — a metric that compares revenue earned over a period of time to the user sessions during that same period.
An essential tool to gauge a website’s performance, RPM will fluctuate over time based on many factors — one of the biggest being how overall industry spend is trending.
A great example of this is seasonality. In Q4, when advertisers are looking for users during the busiest shopping days of the year, we see competition in the ad marketplace increase.
This means advertisers driving up the CPMs for each ad unit which in turn increases the earning potential of all sites running ads on the internet.
When that season is over and we enter the first few weeks of a new year, we see the reverse, with advertising budgets largely diminished, finance teams working to reset those for the new fiscal year and limited demand for that same ad inventory.
So how did Mediavine compare to the advertising industry as a whole through the ups and downs of seasonality and Covid alike?
Let’s examine the data!
Below, you will see a graph in which we illustrate both the year-over-year RPMs of Mediavine publishers and overall ad industry spend.
Mediavine publishers’ year-over-year change in RPM is represented by the teal bars, while the industry-wide change is represented by the red bars.
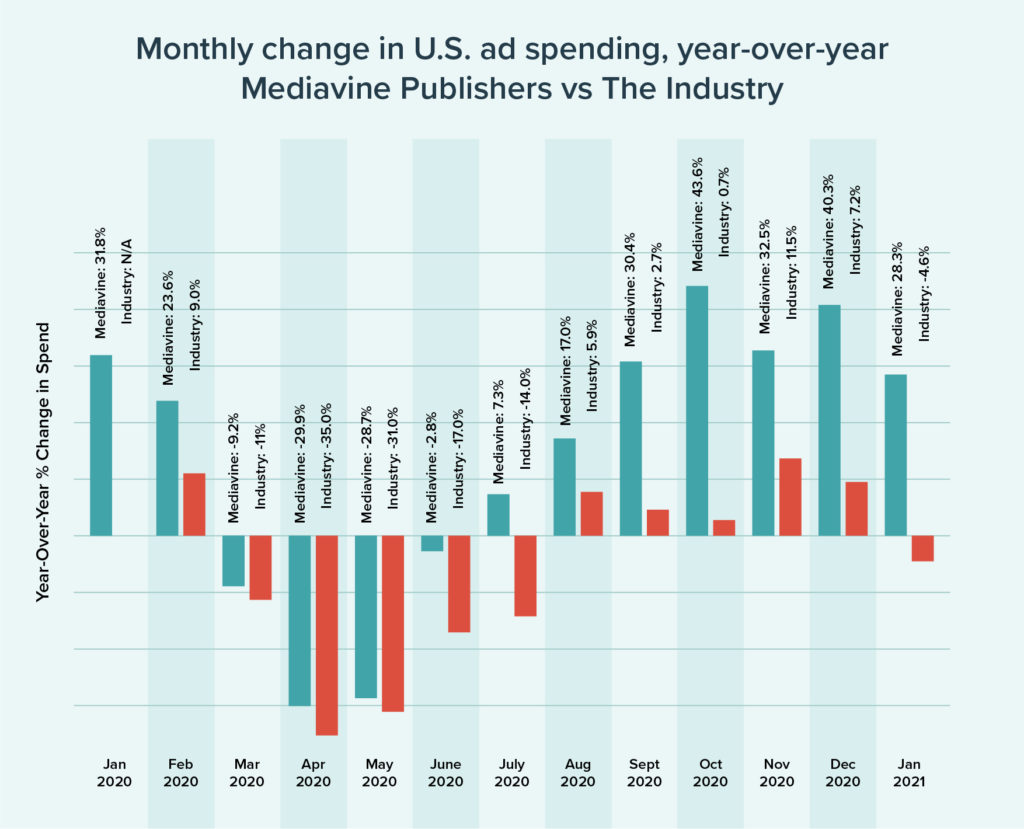
In Q1, Mediavine started out strong. Our sites saw RPMs 32% higher than the previous January, and 24% higher in February despite industry growth rising up 9%.
Then, well, you know what happened last March.
The advertising industry took an abrupt and significant step back in a wave of uncertainty that saw large-scale economic shutdowns and stay-at-home orders.
March, a month that normally finishes much stronger than February, instead saw declines in spend and our publisher RPMs closely followed the trends of the industry.
Then there were the days we’d all like to forget from Q2.
April and May were tough for the industry. Survival mode was a term used all too frequently. Companies focused on ensuring they could survive several lean months, if not more, while pivoting advertising strategies to reflect these new challenges.
As a result, April and May saw advertising spend down 35% and 31% respectively and our publisher RPMs again closely followed these trends.
For Mediavine publishers, things started to turn the corner in June and we began to outpace the industry, largely due to the hard work of our publishers who dug in and met the challenges of the pandemic head on.
We reminded our content creators that there were still ad dollars out there to be had and that when greater demand for inventory returned, they would be in a strong position if they vowed not to give up and worked instead toward recession-proofing their sites.
Meanwhile, incredible work by our Engineering and Ad Ops teams helped us to bring new, high paying outstream ads to publishers on a larger scale, allowing Mediavine sites to capture lucrative video CPMs without so much as lifting a finger.
The video momentum continued throughout the back half of 2020 and into early 2021.
New features such as video playlists were introduced to our publishers, allowing for a more customizable video experience for users, while keeping SEO top of mind.
Our Marketing and Support teams further challenged our publishers as we reached Q4 with proactive advice and techniques to finish a turbulent year on the highest note.
Finally, we’d be remiss if we didn’t mention the exciting rollout and continued development of Grow, a user engagement suite developed by Mediavine for publishers to enhance their websites, improve experiences for users and collect first-party data.
All in all, the hard work and amazing content of our publishers stood out among the rest.
Mediavine publishers were able to capture a significant share of the market spend that remained during the downswing and put themselves in position to succeed so that RPMs eventually not only outpaced spend but blew it out of the water.
We couldn’t be more proud of our team and our 7,800+ publishers who allowed us not only to survive in a time of great uncertainty but emerge from it even stronger.
About the author
Share this page