- Advertising
2020 Year in Review RPM by Category — Behind The Numbers with Brad
•
By now, you don’t need us to remind you what a challenge the last 12 months have been, or why. Personally and professionally, the most difficult part of 2020 was the uncertainty.
From a business standpoint, all of us at Mediavine were on pins and needles wondering how lockdowns, health concerns and changing consumer habits would affect industry spend.
Would we see advertisers scale back, or even close their doors? What does a “new normal” even look like when so many variables are constantly in flux?
More importantly, how would all of this turbulence impact the more than 7,600 publishers that Mediavine works with — and who depend on us –every day?
Now that 2020 is over, the data has been gathered and neatly organized by our Director of Business Intelligence, Cynthia Butler, and I’m happy to bring you some of the most useful insights in the latest installment of BTNWB. (That acronym has taken hold by now, right? Anyone? Sigh, fine. It stands for By the Numbers With Brad).
Below, we’ll review RPM trends from 2020. As usual, we look at RPM from a session level at Mediavine. Here’s what we found by aggregating all Mediavine sites:
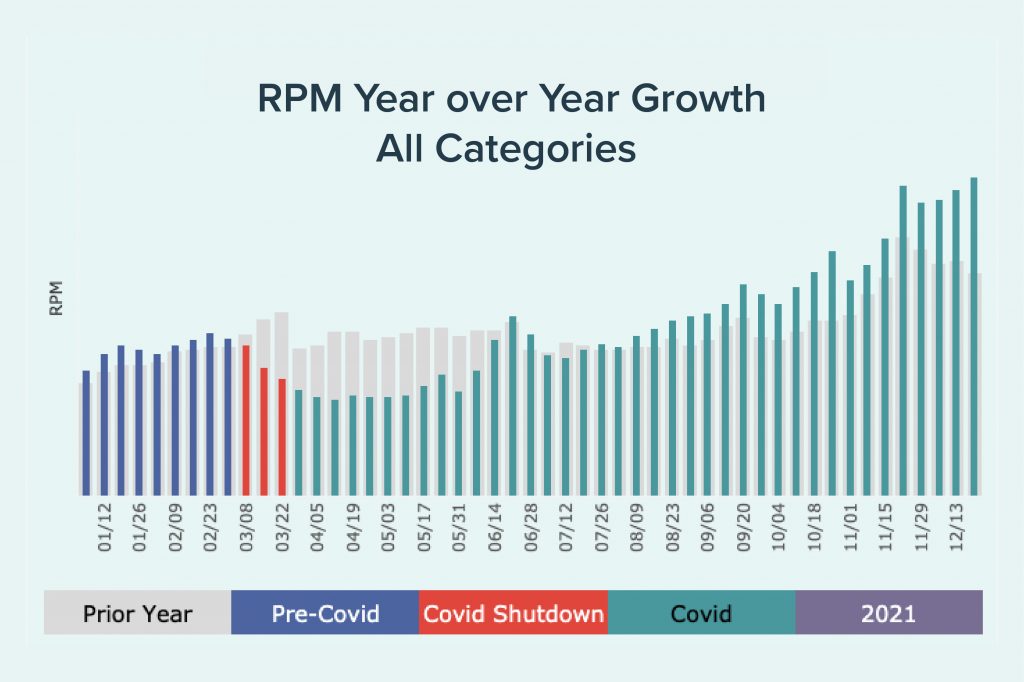
It’s not hard to see when major lockdowns began, and in turn, when advertisers decided to reevaluate their budgets and hold off spending until the dust settled.
We are still living with Covid-19, of course, and with that brings some uncertainty, but RPMs started to recover from the March-April decline in the middle of 2020.
As you can see above, by late July, RPMs were outpacing 2019 and ended up doing so by wide margins as they continued increasing steadily through December.
Some of this increase was likely due to advertisers regaining some lost confidence, not to mention previously-withheld budgets being reinjected into the market.
But don’t discount the collective work behind the scenes by Mediavine’s hard working teams who found incredible ways to increase publishers’ earnings per session.
Our engineering and operations experts worked tirelessly on technology initiatives such as outstream video, faster server-to-server connections and much more in 2020.
Marketing churned out amazing and engaging content, and our sales force (virtually) knocked on more doors than ever before, garnering new and exciting deals.
As always, our award-winning support teams were everyone’s rock, lending unparalleled and unwavering guidance to a bigger, more diverse group of publishers than ever.
On that note, we would be remiss if we didn’t applaud our publishers themselves. Countless times we saw people take the challenges of recent months and turn them into opportunities — optimizing their sites and pages with remarkable results.
Arts and Entertainment
With indoor gatherings prohibited, restricted or simply less desirable due to the pandemic, advertisers quickly backed away from the entertainment industry.
Audience interest in arts and entertainment content also slowed in some cases, given the onslaught of news in a year that was oftentimes chaotic.
As summer came to a close though, Mediavine started to see a slow but steady increase in overall RPM for entertainment sites which continued.
By the end of the year, the category was more or less back to “normal” — at least to the point where there’s reason for optimism in 2021.
Food & Drink
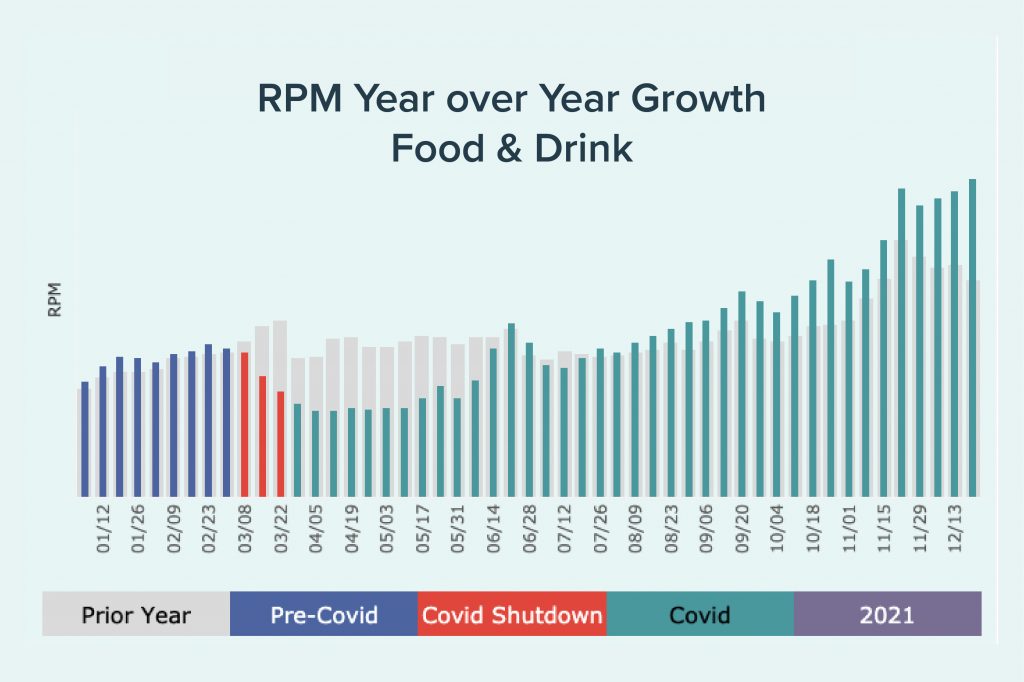
You’ll begin to see a pattern emerging with each of these graphs, regardless of category. A downward trend in overall RPM through the summer months, followed by an upward trend through the rest of the year, also summarizes the food and drink space.
The spring declines in RPM were mitigated somewhat by record traffic in 2020 for our food & drink sites as people sought recipes and meal ideas from the internet like never before.
Advertisers were still wary about putting money into the market during the summer months, but demand ramped up before the holidays and finished the year incredibly strong.
Travel
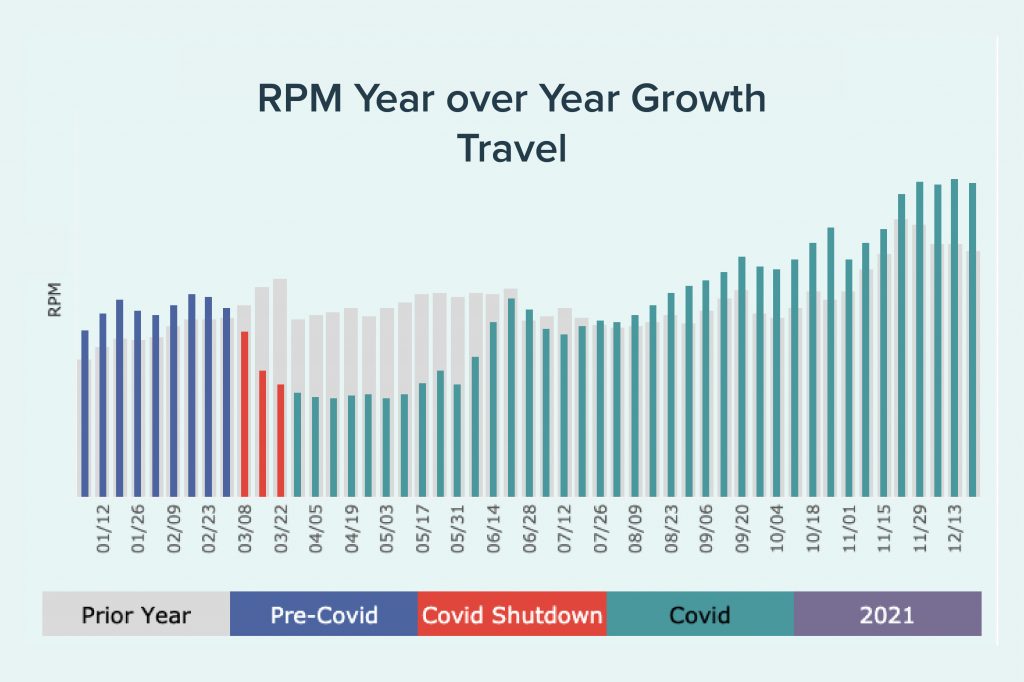
A frequent topic of the BTNWB posts has been travel sites.
No group of publishers was more affected in traffic and RPM in the past year. Given what a global event this was, and all the uncertainty surrounding it, that’s not a surprise.
The bad news has been obvious and covered at length. The good news is that travel was no exception to the pattern of RPMs steadily climbing in the second half of 2020.
A sign of a resurgence in the industry and more confident travelers? We sure hope so, for everyone’s sake. Working at home is only fun when you can occasionally leave.
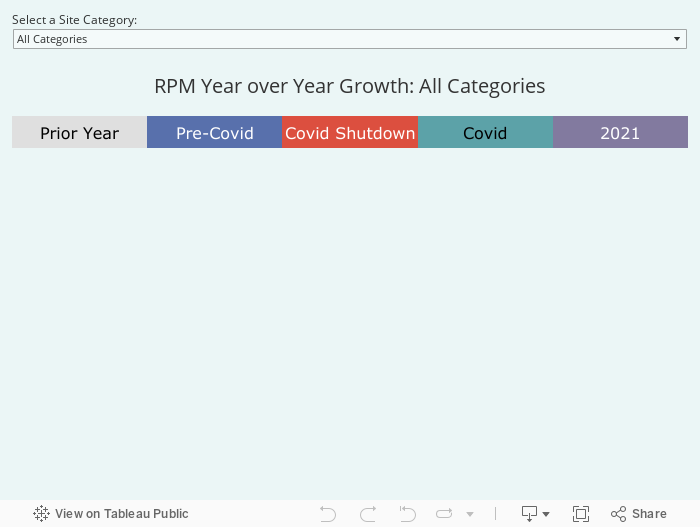
All kidding aside, check out the interactive chart below to browse through the rest of the site categories that call Mediavine home and see how they performed.
The trends for each of them point to a positive end to the year and hopefully to the beginning of a new year with a less volatility and more continued growth!
About the author
Share this page