Advertising
2020 Year in Review Sessions by Category — Behind The Numbers with Brad


A year that, in many ways, felt like a lifetime is finally coming to a close, and the end of 2020 brings hope for a less “unprecedented” 2021.
The past year not only tested our resolve; it forever changed the way that we live — and the landscape of the industry we depend on.
Fewer seats at restaurants led to more cooking, travel restrictions nixed our vacations and more time on our hands led to many new hobbies.
Some of our pandemic-driven behaviors have become the new “normal” now; others not so much. Hopefully toilet paper collecting will be considered so 2020.


As a group of content creators who are also parents, teachers, mentors, hobbyists and a mosaic of our society to which the average person can easily relate, Mediavine publishers certainly experienced the ups and downs of this year first hand.
In this edition of Behind the Numbers with Brad (BTNWB, an amazing acronym that is going to take off in 2021), let’s take a look back at 2020 from a web traffic perspective.
We previously explored the Covid traffic topic using data from Mediavine publishers in early July, and it’s worth revisiting again as we continue to see evidence of a world that is tapping into the content of bloggers like never before.
Our Director of Business Intelligence, Cynthia Butler, analyzed how Mediavine publisher traffic trends have changed from one year to the next using session data and our internal site level categorizations. I’ve highlighted some of these trends below.
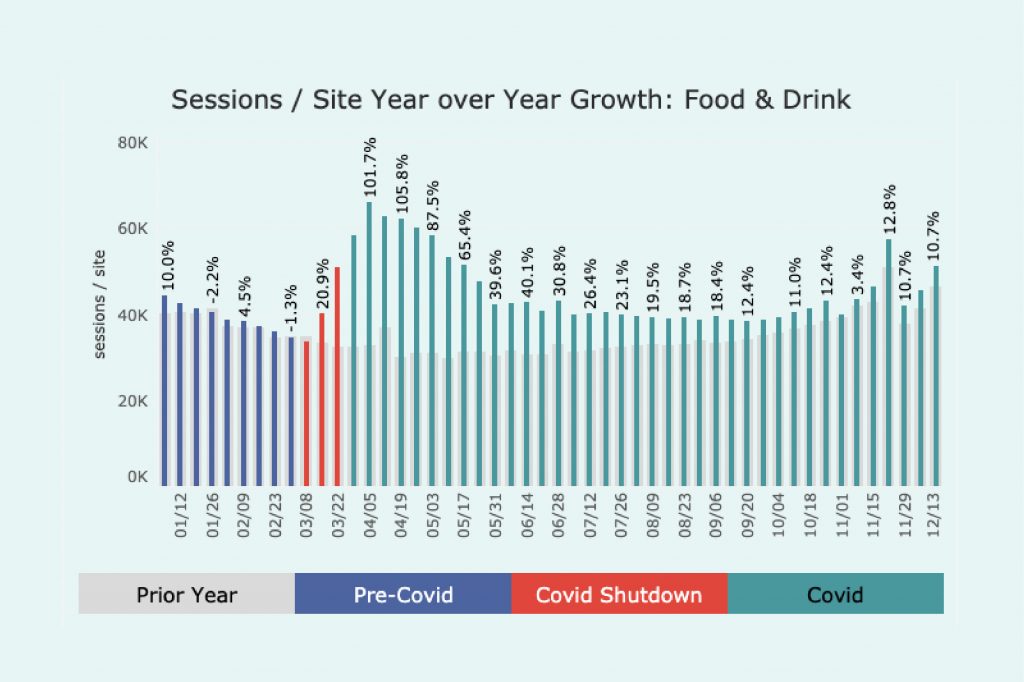
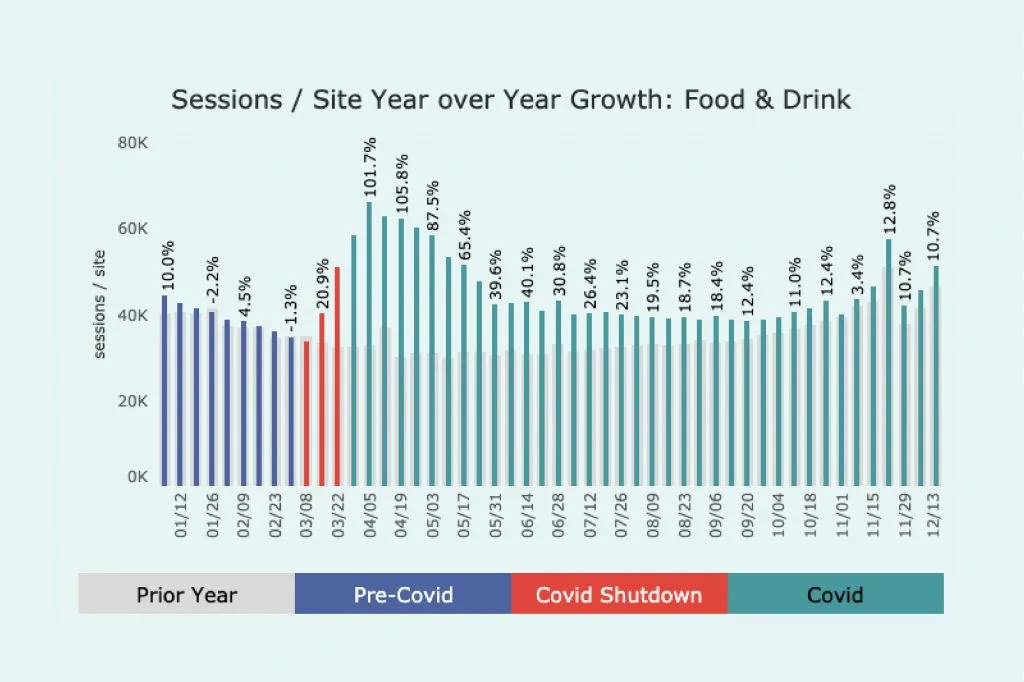
Our Food & Drink sites saw a huge increase in traffic shortly after the near-universal Covid shutdowns — a period we’re categorizing as mid-March to early April — and many of these newfound culinary artisans stuck with it. Traffic for these sites more than doubled year over year.
Some of their traffic tapered off in the summer months as restrictions were lifted, food delivery apps caught up with demand and more outdoor dining options were available, but we’re still seeing about a 10% increase from 2019 since October.
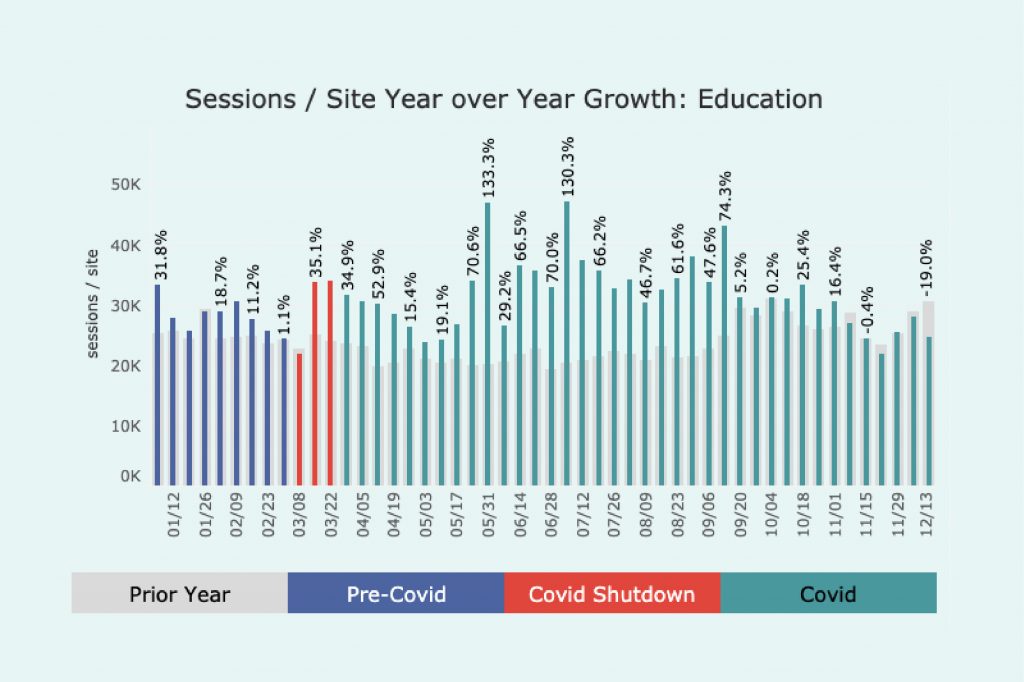
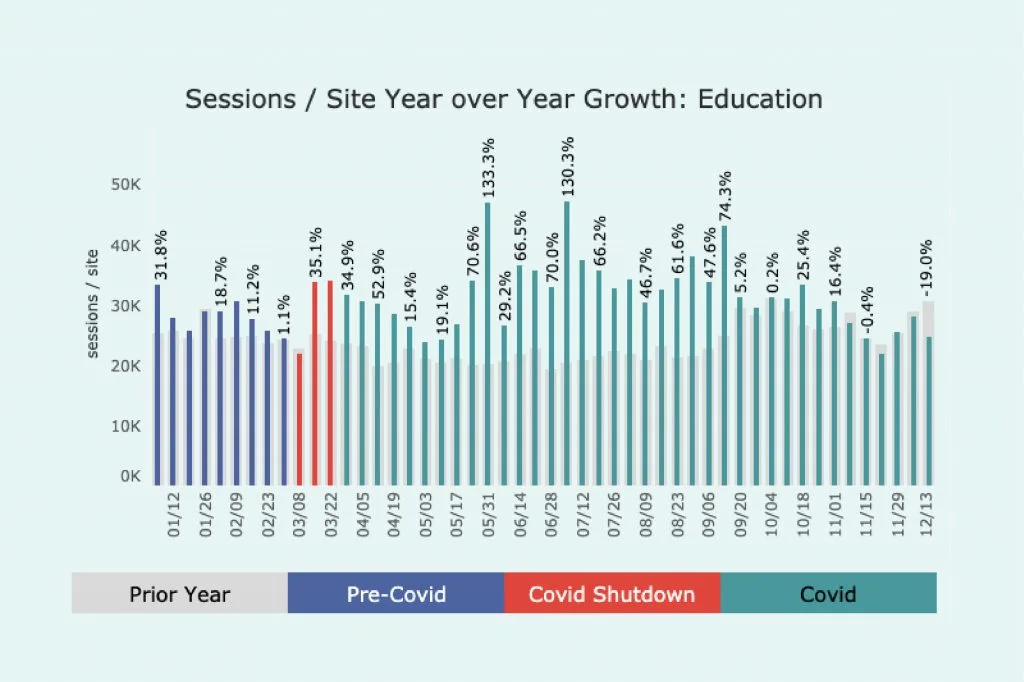
The education traffic trend paints a picture of a world where parents were trying to keep the kids busy, active and learning all spring and summer. As soon as the fall school year began (even if that meant virtually) we saw that traffic quickly drop off.
A large portion of this traffic is also likely due to hard-working teachers putting lesson plans together and trying to figure out how to teach our children during this very unique time.
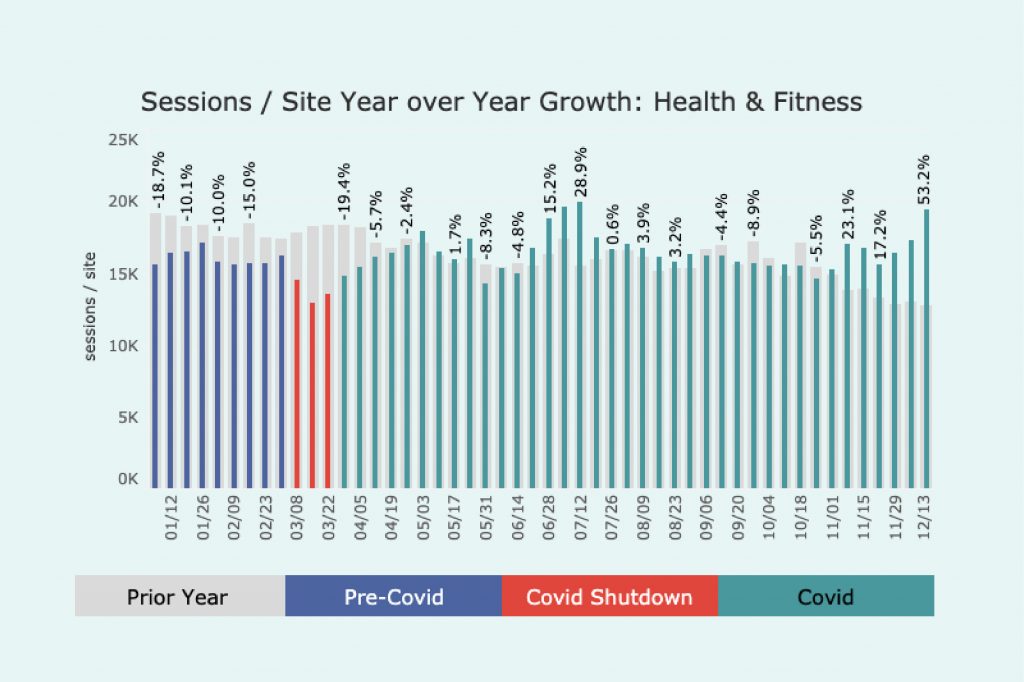
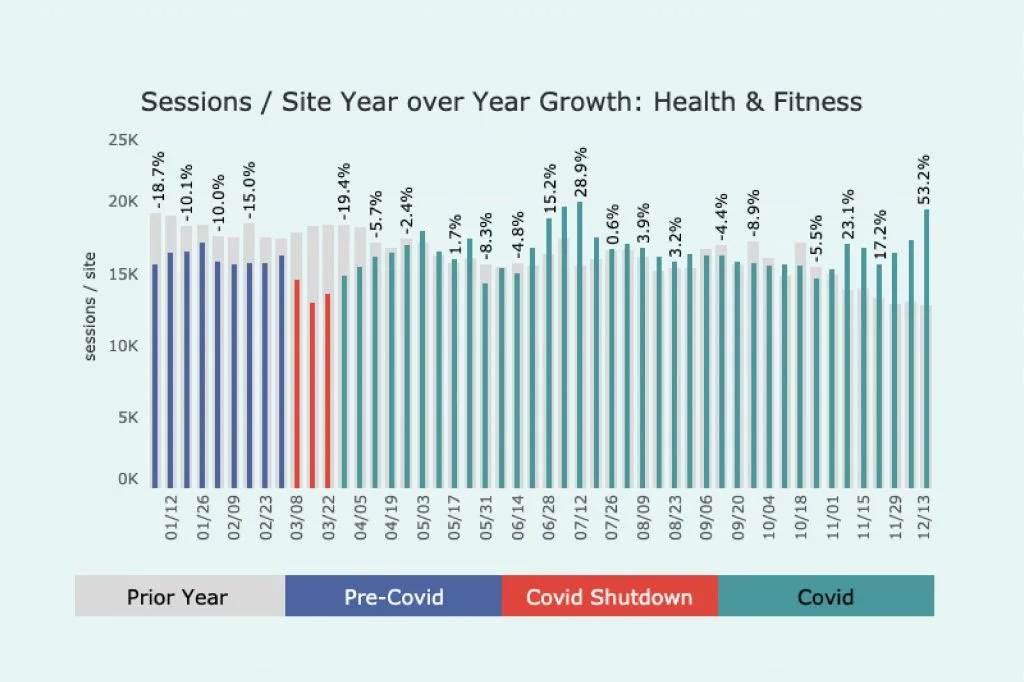
One of my personal favorites, and a category that tells a great story, is our health and fitness traffic, which saw slight decreases when Covid first hit.
Between gym closures, colder weather and a general inclination not to leave the house, traffic noticeably dipped before rebounding over the spring and summer.
Those trends held relatively stable until early November, when perhaps web users began thinking about New Year’s resolutions and/or shedding some extra pounds in anticipation of holiday get-togethers (“the Covid-19” or “the Quaran-15” if you will).
As you can see, this traffic is currently spiking, and with the actual New Year upon us, there’s no reason to think it won’t continue for at least a few more weeks.
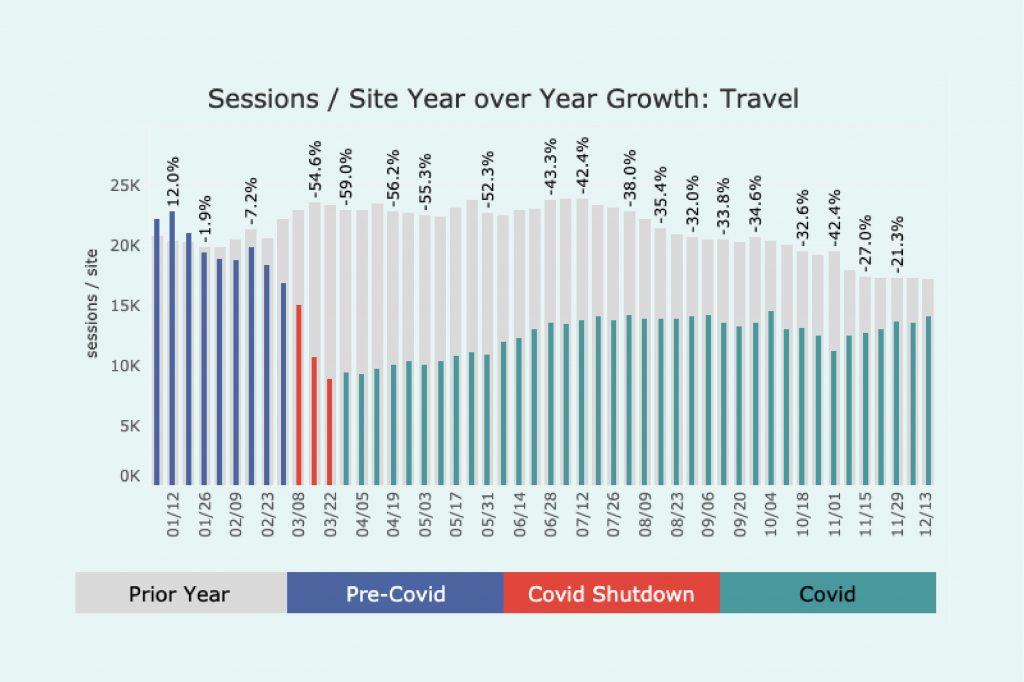
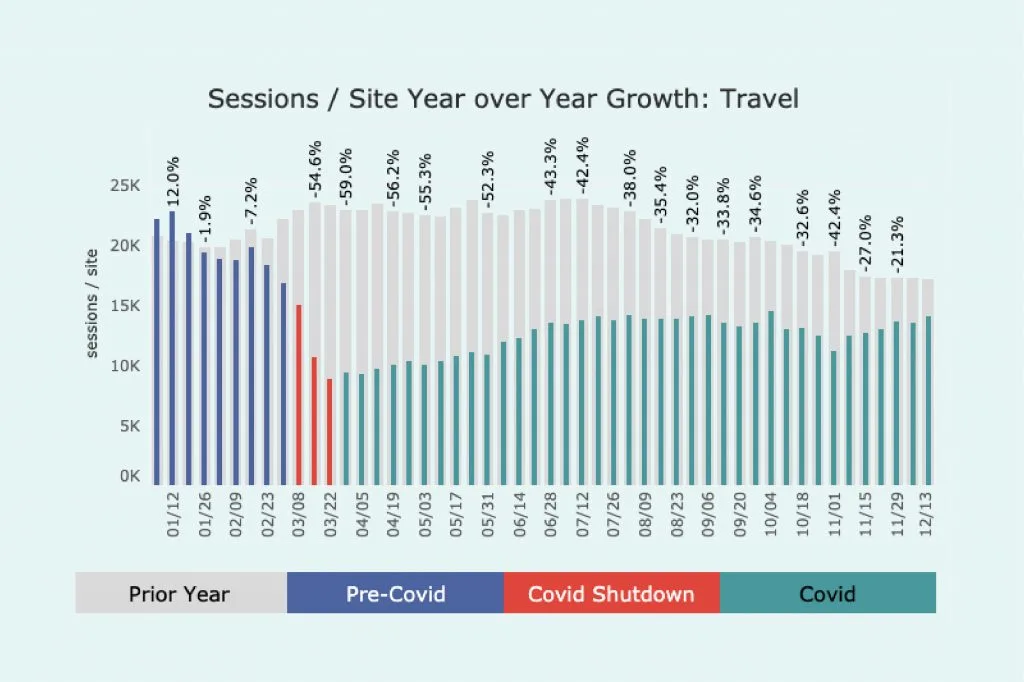
I say this in every BTNWB post and this time is no different; no niche was more negatively impacted than our travel sites in 2020 — for obvious reasons.
Traffic bottomed out with a near 60% decrease year over year during peak shutdowns, but for travel publishers there is some good news to be found.
You can already see a slow but steady rebound inching closer to 2019 levels above. With Covid vaccines increasing in availability and, if things progress from a public health standpoint, 2021 could be a big year for this category due to all the pent-up demand.
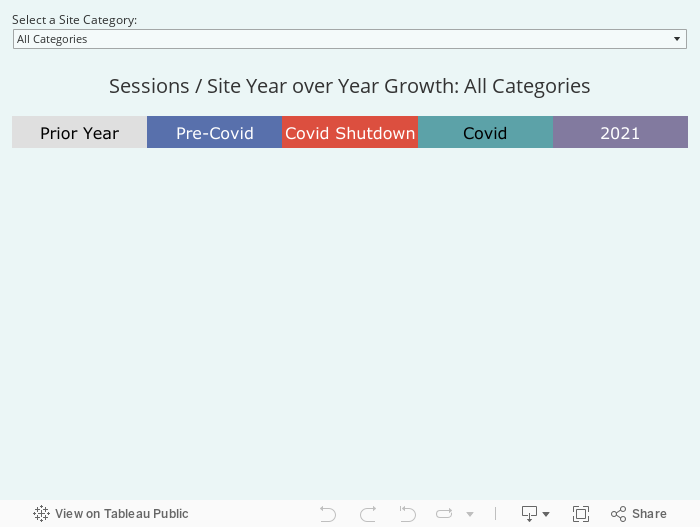
I’ve included an interactive chart below that outlines all of the different website categorizations we work with at Mediavine. Each tells an interesting story of our changing landscape, and I encourage you to browse around and try to figure out the trends for each.
Obviously, no one knows what 2021 will bring, but the Mediavine team and I look forward to continuing providing insights as we move through a new year.
Without question 2020 data will be fascinating to look back on in the rearview mirror, and for data nerds like myself, I’ll take that as a silver lining. That, along with the 170 extra rolls of toilet paper in my garage.
All kidding aside, Mediavine is always here to provide support and stand behind our mission to help content creators not only survive but prosper despite whatever factors — from industry changes and regulations to economy altering events — come our way.
Stay up to date with the latest from Mediavine

 Eric Hochberger
For the past year, Google has been experimenting with a feature called Recipe Quick View – a feature allowing users to click an icon inside search results to view an …
Eric Hochberger
By now, we’re all aware that generative AI is dramatically changing the web, leaving content creators — whose work is used to train powerful AI models — under duress. But …