- Analytics
What is Performance: How to Measure, How to Compare
•
What is Performance?
What do you consider performance? Is it how you’re tracking compared to a goal you set? How you’re performing compared to another website? Week over week? Year over year? There are so many different ways to monitor and analyze performance. Some can be complicated, others pretty straightforward. Here’s a simple step-by-step process, and some tips to help analyze your performance for the more complicated questions.
Step 1: What is Your Ultimate Goal?
Do you want to increase revenue? Do you want to hit 1 million sessions? Do you want to increase your traffic from social media? Focus your analysis on what will help you achieve your goal. Most likely, there will be more than one step to take, and more than one action needed to reach your ultimate goal. This is very typical. Just keep your goal in mind as you monitor results. Helpful Tip: Don’t make the ultimate goal unreachable. It’s also easier if you build a number into your goal, e.g. “Increase revenue 10%” vs. “Make more money.” For the sake of this blog post, we’re setting an ultimate goal for you to follow along with: Reach 1 million sessions per month. Growing site traffic is a great goal. (Go you!) We have a number of resources to guide you on the road to achieving your goals. In this scenario, let’s say we worked on increasing pagespeed and it went up 20%! (Here’s a post on how to increase pagespeed.) We’ll use this example throughout the steps to help guide you through your own analysis. Now we’ll look at how increasing pagespeed helped us attain our ultimate goal of 1 million sessions per month. NOTE: You can follow these steps for any goal, so use our example as a jumping off point as you follow the rest of the steps.Step 2: What Question Do You Want to Answer?
Next, determine the question you want an answer to. It could be really simple, such as “How many sessions did I have yesterday?” It could be more complex, such as “Has changing pagespeed impacted my session growth?” Figure out the question before looking at the numbers. This may sound backwards, especially if you only have a specific data set, but there are times that seeing the data could influence your question. Helpful Tip: Be specific. Asking something like “Did my revenue go up?” is generic and may not lead to results that can help guide you. Our Example Question: “How much have my sessions grown since my pagespeed went up 20%?”Step 3: Do I Have the Data I Need?
The next step is figuring out if you have the data you need. In certain cases, you might not. If that’s true, there are still ways to infer answers (we’ll go over some of these later). Helpful Tip: Focusing on 2-3 things helps you zero in on the question. Too much data can create noise and not provide actionable insights. Our Example Data:- Date pagespeed changed (10/1/2019)
- Pagespeed before 10/1/2019
- Pagespeed after 10/1/2019
- Sessions by Day
Step 4: What Do I Want to Compare?
If you’re looking at performance, you probably want to compare it with something, most likely a date range. Keep in mind that multiple factors might impact the comparison. For example, Sunday performance differs from Monday, January performs differently than June, Google Search traffic performs better than Pinterest, and so on. Helpful Tip: Focus on one or two comparisons. Also make sure you give the data time to adjust to any changes you have made. Our Example Metrics:- 7 Day period before change (9/22/2019-9/28/2019)
- 7 Day period after change, plus a few weeks (10/13/2019-10/19/2019)
Step 5: What Metrics Will Help Answer My Question?
We could throw out many three-letter acronyms, but which ones mean something to you? If your question is “Has changing pagespeed impacted my session growth?” then looking at CPM won’t help you. Again, there are a lot of metrics. Always focus on the question you want to answer. Obvious as it sounds, it’s easy to spiral down into a rabbit hole without that focus. Useful metrics can be RPM, CPM, Sessions, Revenue, Pageviews and/or Impressions. You can also break each of these down by Geo, Device Category, Day of Week, Traffic Source, etc. Helpful Tip: Make sure the metrics link exactly to your question. CPMs may be affected by session growth, but session growth won’t be impacted by CPMs. Our Example Metrics: Date, SessionsStep 6: How to I Analyze the Data?
There are many different ways to analyze data. One that is usually very effective is % change. For example, if your RPM changes from $25 to $30, the change would be 20% growth. To calculate % change, take the number you want to compare ($30 in the above example), subtract the number you’re comparing to ($25), and divide the answer ($5) by the number you’re comparing to ($25):($30-25) / ($25) = .2 = 20%
Helpful Tip: Perhaps you had an article go viral and this could account for your session growth. Always look to see if there are outlying factors that could have influenced results. Also, keep track of any changes you might have made, such as adding or removing a plugin, changing ad settings, etc. Any of these might skew the data. Our Example:- Sessions between 9/22 – 9/28: 105,000
- Sessions between 10/13 – 10/19 – 125,000
(125,000 – 105,000) / (105,000) = .19 = 19% session growth
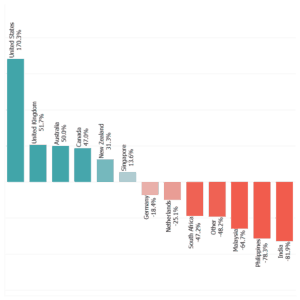
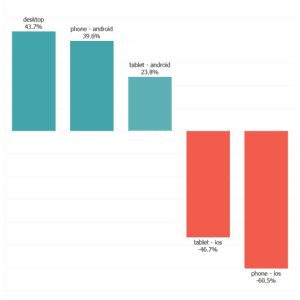
Advanced Tips Try to piece out if data is correlated. Just because a bird flies by your window doesn’t mean your hair is turning gray (that might just be my hair … I blame my kids). Two things that have no relationship can occur simultaneously. Keep a spreadsheet of any changes you make with plugins, layouts, styles, SEO, etc. with dates. This gives you historical reference points that you may not remember a month from now. Inferring Data There are times when you don’t have all the data in front of you. For example, if you’ve increased your Google traffic due to SEO improvements, you might also see an increase in RPM using the above tools. Even if you don’t have Google session RPM broken out, you can use the data in this article to help infer that RPM has increased because Google sessions increased, illustrating the value of improving SEO. Here are some basic data points to keep in mind when looking through data: Referral Source Value Most publishers know that not all traffic is created equal. You may be surprised at just how much more some referral sources are worth to your site than others, though. Keep that in mind when you look to increase your users. Below is a graph showing the value of sources compared to one another. For example, Google traffic is worth 10.1% more than average. If you grow Google traffic, your RPM would be impacted positively, especially compared to increasing your traffic from Instagram. 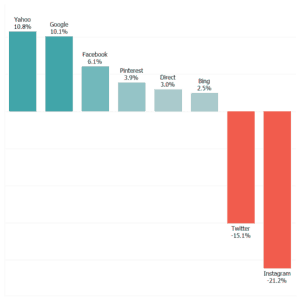
 Try it Yourself
We put together a simple spreadsheet to help you try these new tools yourself:
https://docs.google.com/spreadsheets/d/1ApFwrakOcJCyjJT1zTu8gScBsmEIH0X305unMMuGTXg/edit#gid=0
Using your dashboard data, pull in data from last Monday (New) and compare it to data from the Sunday (Original) before. See if you can figure out which of those two days performs better for your site.
You can use this information to help inform you on when to post updates on social media, add blog posts, etc., to maximize revenue.
Good luck! As always, feel free to leave a comment or email publishers@mediavine.com with any questions you have along the way.
Try it Yourself
We put together a simple spreadsheet to help you try these new tools yourself:
https://docs.google.com/spreadsheets/d/1ApFwrakOcJCyjJT1zTu8gScBsmEIH0X305unMMuGTXg/edit#gid=0
Using your dashboard data, pull in data from last Monday (New) and compare it to data from the Sunday (Original) before. See if you can figure out which of those two days performs better for your site.
You can use this information to help inform you on when to post updates on social media, add blog posts, etc., to maximize revenue.
Good luck! As always, feel free to leave a comment or email publishers@mediavine.com with any questions you have along the way.About the author
Share this page