- Advertising
Holiday RPM Trends — Behind the Numbers with Brad
•
Well folks, we made it.
After 10 months in which we’ve heard the word “unprecedented” infinite times, and a political season to match 2020’s craziness, November is here.
We’re smack in the middle of Q4, when a quick glance at our publisher Dashboards each morning can cause one to break into a holiday song:
“It’s the most wonderful time of the yearrrrrrr!” Just take a look at this actual archival footage of a Mediavine publisher after checking their Q4 RPM.
Yes, Q4 is a magical time filled with spirit, verve and ever-increasing CPMs. But what can we expect specifically, from now until 2021?
I’m glad you asked!
In this edition of Behind the Numbers with Brad, I’ve once again teamed up with Cynthia Butler, our talented Director of Business Intelligence, to shed some light on this topic.
In previous editions of BTNWB (we love our acronyms in this industry, however ridiculous), we’ve explored how Covid has impacted publisher traffic and RPMs in 2020.
While it’s clear that Covid is far from over, the good news is that the advertising industry has adjusted and seems to have found some stability, even in uncertain times.
Budgets that were paused earlier this year during peak panic have been reinjected into the marketplace, leading to a strong performance as we close out the year.
Moreover, many businesses have adapted new and exciting ad campaigns, thanks to fresh strategies such as online delivery and curbside pickup.

Will this mean that November and December 2020 follow the same patterns we saw in 2019? We sure hope so, but there’s no guarantee (see upcoming disclaimer).
Let’s get to the numbers. We took a look back at 2019, by site category, to analyze RPMs week over week from the beginning through the end of the fourth quarter.
We uncovered some interesting Q4 trends. I want to highlight a few that stood out the most, along with my most logical explanation for each.
Food & Drink
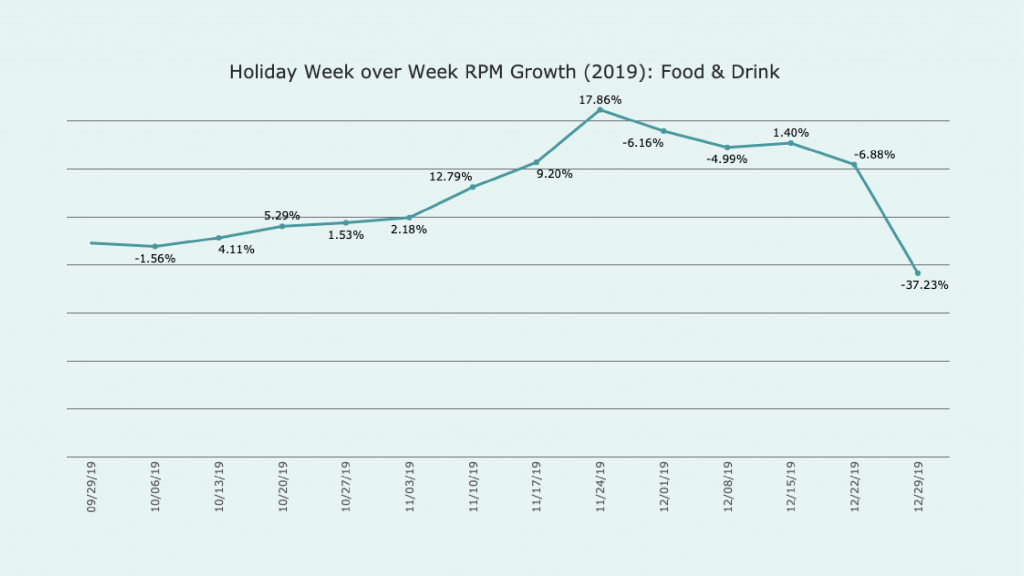
Steady growth starting around the middle of October, and booming right before Thanksgiving, is the trend line for sites in the Food & Drink category.
These revenue trends also come at a great time of traffic growth. People are looking for new recipes for the holidays, and advertisers want to be a part of it.
Even after the tryptophan hangover wears off, RPMs stay high before taking a slight dip at the beginning of December due to the start of a new month.
RPMs then remain on the high side right through the end of the year, before taking a sharp downturn in the last week of December after Christmas.
At that point, even though it’s technically still Q4, advertising budgets are exhausted and consumers are less likely to be shopping.
Health & Fitness
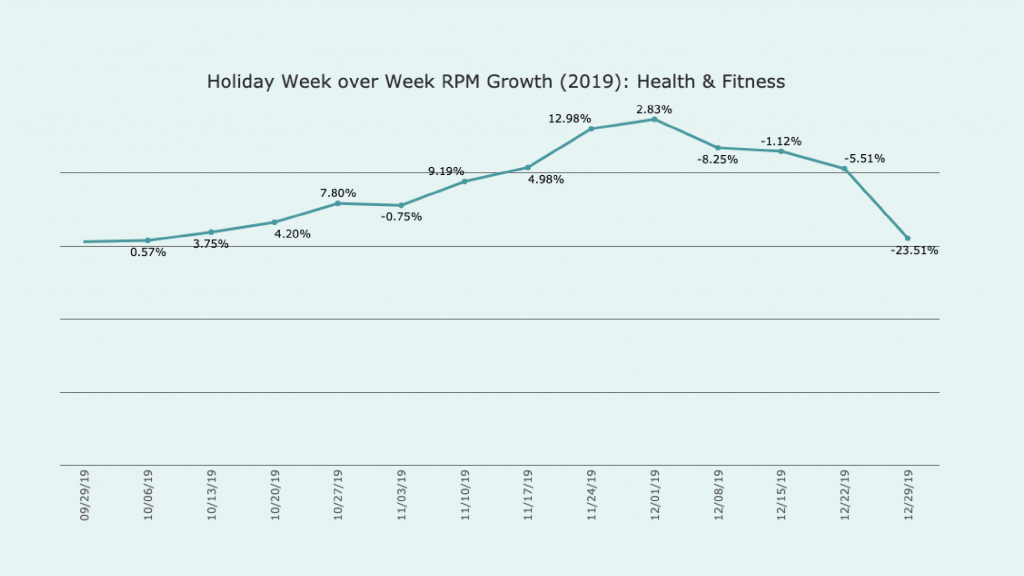
Something that I found interesting: our Health & Fitness sites follow roughly the same trend lines as Food & Drink sites but with a sharper drop off after the first week of December.
This tells me that companies and brands are eager to get in front of health-conscious eaters ahead of Thanksgiving, before taking a pause and looking forward to January 1 and the ambitious resolutions that a new year brings.
Personal Finance
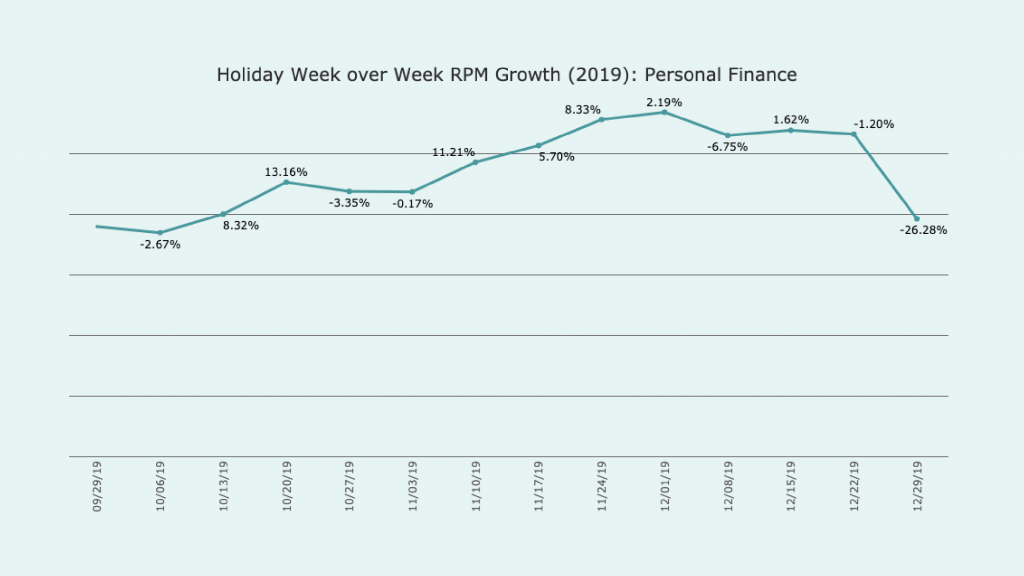
The RPM trend from our Personal Finance category of sites also tells a great story.
We see much more steady growth throughout Q4 than most of our other categories, with only slight dips near the beginning of each month.
Advertisers on these websites are likely targeting the budget-conscious population. They have deals galore starting in October and continuing all the way through Halloween, Thanksgiving, Black Friday, Cyber Monday (or as those of us who work from home call it, Monday) and Christmas.
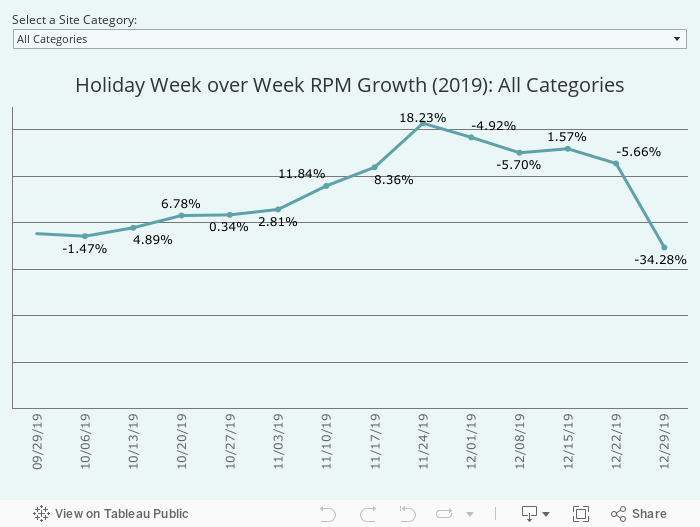
Take a look at the fun interactive table below to see for yourself how RPM changes vary week over week for various site categories.
Now for the disclaimer, because what would 2020 be without some unpredictability?
With Covid making a strong resurgence in some areas, and uncertainty surrounding the elections, we may see some changes in these numbers compared to last year.
Generally, the ad industry follows the overall climate of the economy. When the economy widely shut down in March, advertising ground to a halt.
Since then, it’s recovered somewhat and if the economy keeps running smoothly with the majority of businesses open, we should continue to see strong ad spend.

If conditions worsen and we experience shutdowns similar to Q1 of this year, which we can’t predict one way or the other, it could be a different story.
To put it more simply, these numbers are subject to change from year to year because 2019 and 2020 have been wildly different years but hopefully they won’t!
Either way, Mediavine is always well positioned to earn the most possible for its publishers and we look forward to a future post where we can recap and compare the two.
About the author
Share this page